2025 FORT Price Prediction: Analyzing Market Trends and Growth Potential in the Post-Halving Crypto Landscape
Introduction: FORT's Market Position and Investment Value
Forta (FORT), as a decentralized monitoring network for blockchain security and operations, has been playing a crucial role in real-time threat detection since its inception. As of 2025, Forta's market capitalization has reached $31,780,863, with a circulating supply of approximately 625,484,416 tokens, and a price hovering around $0.05081. This asset, often referred to as the "Web3 Security Guardian," is increasingly vital in safeguarding DeFi, NFT, governance, bridges, and other Web3 systems.
This article will provide a comprehensive analysis of Forta's price trends from 2025 to 2030, considering historical patterns, market supply and demand, ecosystem development, and macroeconomic factors to offer professional price predictions and practical investment strategies for investors.
I. FORT Price History Review and Current Market Status
FORT Historical Price Evolution
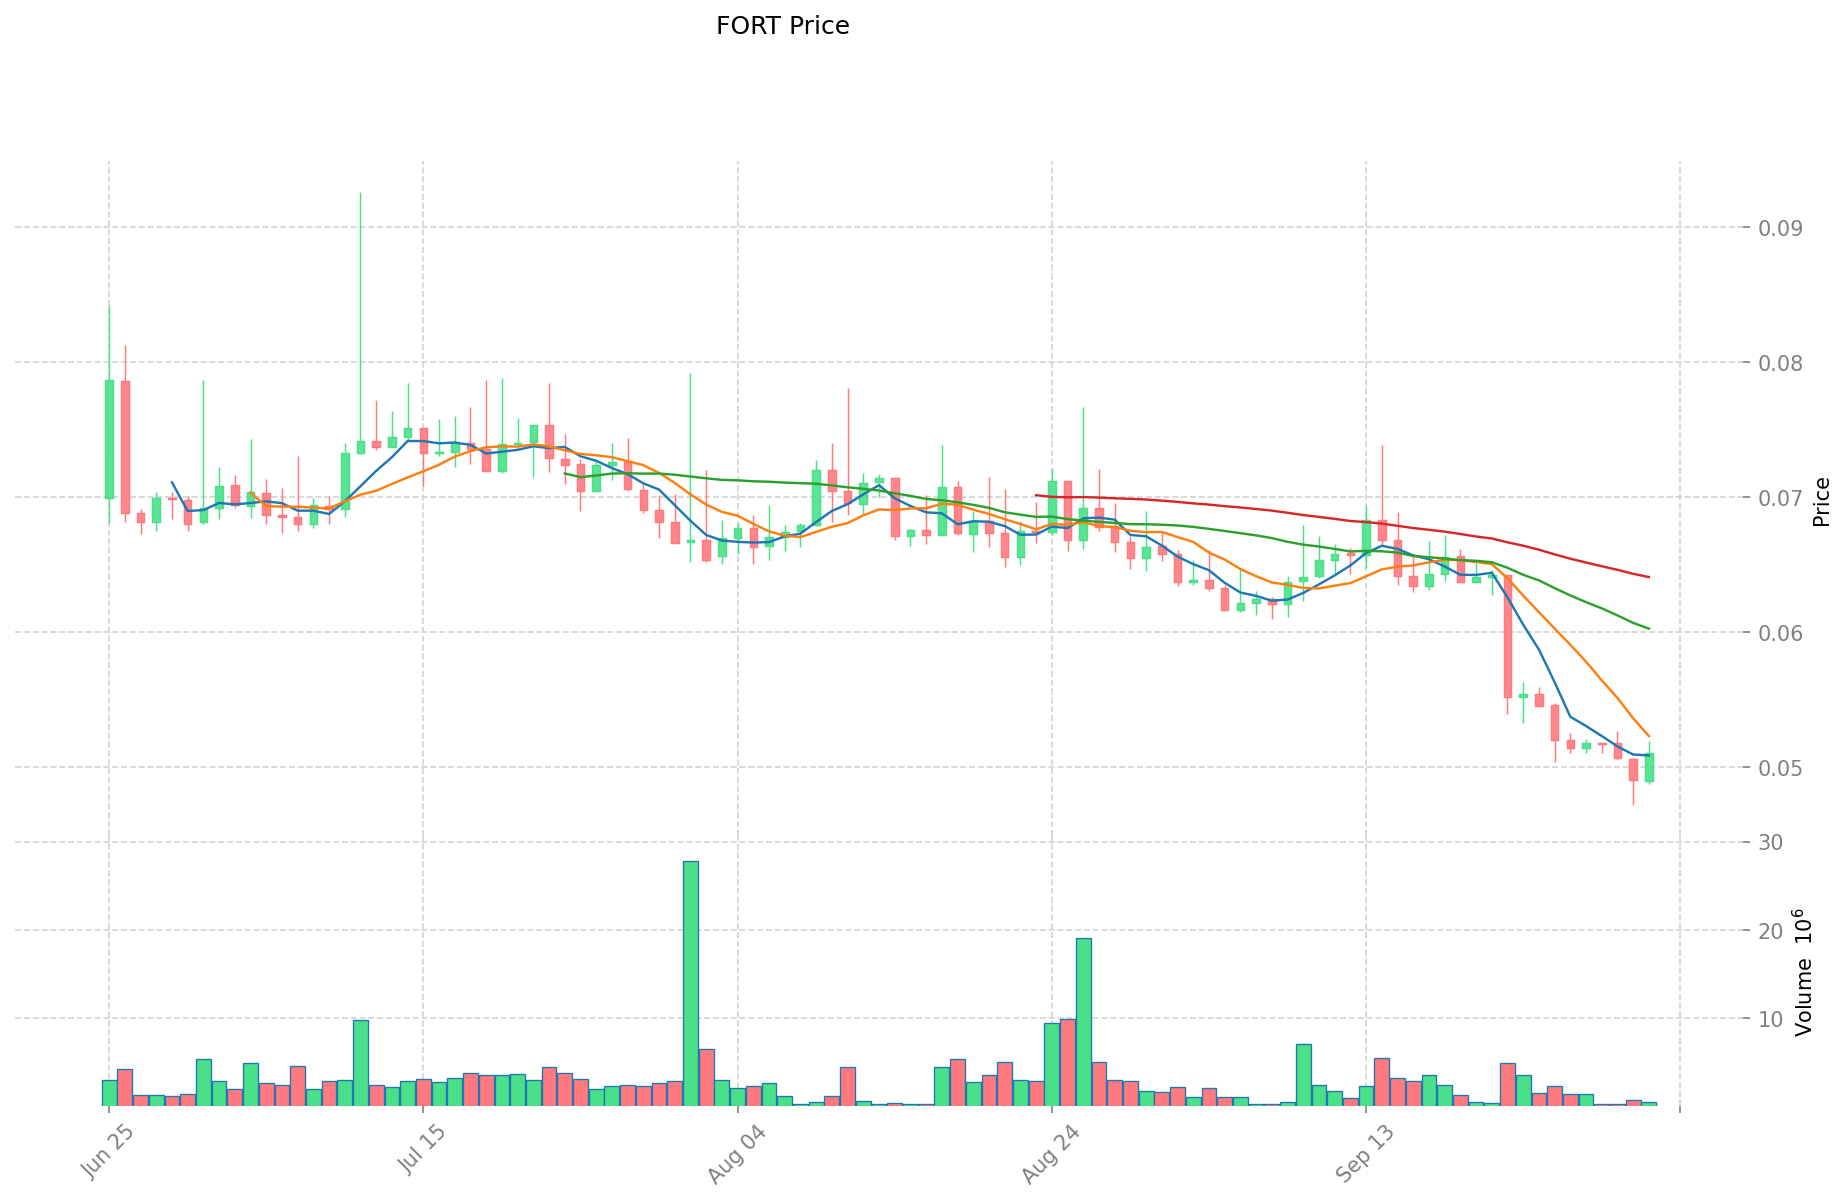
- 2022: FORT reached its all-time high of $0.964645 on June 16, 2022, marking a significant milestone for the project.
- 2023-2024: The cryptocurrency market experienced a prolonged bear market, with FORT price gradually declining.
- 2025: FORT hit its all-time low of $0.04734884 on October 1, 2025, reflecting the overall market downturn.
FORT Current Market Situation
As of October 2, 2025, FORT is trading at $0.05081, showing a slight recovery from its recent all-time low. The token has experienced a 3.96% increase in the past 24 hours, indicating a short-term positive momentum. However, the longer-term trends remain bearish, with a 6.79% decrease over the past week and a significant 21.42% drop in the last 30 days.
The current market capitalization of FORT stands at $31,780,863, ranking it 882nd among all cryptocurrencies. With a circulating supply of 625,484,416 FORT tokens, representing 62.55% of the total supply, the project maintains a relatively high circulation ratio.
Despite the recent price increase, FORT is still trading 94.73% below its all-time high, reflecting the substantial decline in value since its peak in June 2022. The token's trading volume in the past 24 hours is $25,842.87, indicating moderate market activity.
Click to view the current FORT market price
FORT Market Sentiment Indicator
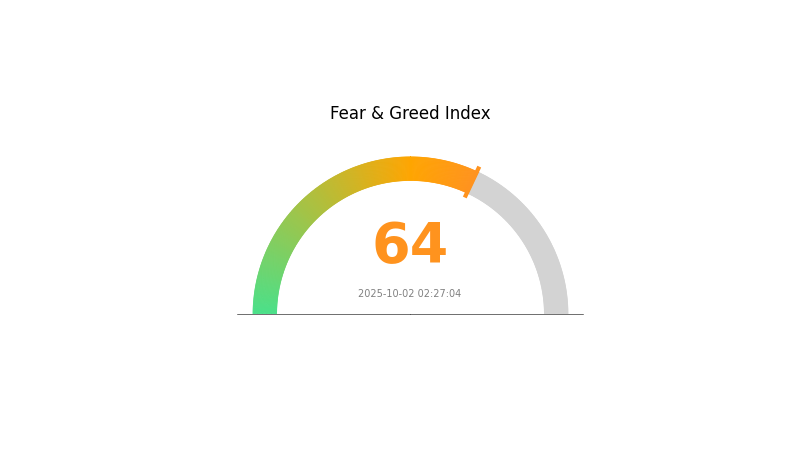
2025-10-02 Fear and Greed Index: 64 (Greed)
Click to view the current Fear & Greed Index
The crypto market is currently exhibiting signs of greed, with the Fear and Greed Index reaching 64. This suggests investors are becoming increasingly optimistic, potentially driving prices higher. However, caution is advised as excessive greed can lead to market corrections. Traders should consider taking profits or implementing risk management strategies. Keep an eye on key resistance levels and market fundamentals to make informed decisions in this bullish environment.
FORT Holdings Distribution
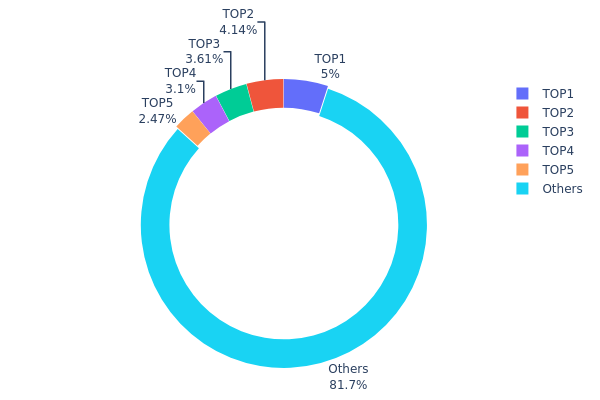
The address holdings distribution data provides insight into the concentration of FORT tokens among different wallet addresses. Analysis of this data reveals a relatively decentralized distribution pattern for FORT. The top 5 addresses collectively hold 18.29% of the total supply, with the largest individual holder possessing 5% of tokens. This distribution suggests a moderate level of decentralization, as no single entity has an overwhelming concentration of tokens.
The current distribution structure indicates a healthy balance between major stakeholders and smaller holders. With 81.71% of tokens distributed among numerous "other" addresses, FORT demonstrates a wide base of participants. This dispersed ownership potentially contributes to market stability and reduced vulnerability to large-scale manipulations. However, it's worth noting that the top holders still retain significant influence, which could impact price movements if large transactions occur.
Overall, FORT's address distribution reflects a relatively mature market structure with a good degree of decentralization. This distribution pattern may foster a more resilient ecosystem, potentially reducing extreme volatility and enhancing long-term stability for the FORT token market.
Click to view the current FORT Holdings Distribution
| Top | Address | Holding Qty | Holding (%) |
|---|---|---|---|
| 1 | 0xfd15...5045f0 | 50005.00K | 5.00% |
| 2 | 0xc2c8...359564 | 41353.73K | 4.13% |
| 3 | 0x61d0...192762 | 36146.35K | 3.61% |
| 4 | 0x40ec...5bbbdf | 30960.14K | 3.09% |
| 5 | 0xf6af...f2c7af | 24663.32K | 2.46% |
| - | Others | 816871.46K | 81.71% |
II. Key Factors Affecting FORT's Future Price
Supply Mechanism
- Historical patterns: Past supply changes have shown significant impacts on price fluctuations.
- Current impact: Expected supply changes may influence future price movements.
Institutional and Whale Dynamics
- Corporate adoption: Notable companies adopting FORT include Ford, which has been expanding its electric vehicle production.
Macroeconomic Environment
- Monetary policy impact: Central bank policies, particularly interest rate decisions, are expected to play a crucial role in shaping FORT's price.
- Inflation hedging properties: FORT's performance in inflationary environments may affect its attractiveness as an investment.
- Geopolitical factors: International situations and political events could influence FORT's price movements.
Technical Development and Ecosystem Building
- Electric vehicle market: The growing demand for electric vehicles, particularly Ford's EV models, is likely to impact FORT's price.
- Ecosystem applications: Ford's ongoing developments in the EV sector and related technologies may contribute to FORT's ecosystem growth.
III. FORT Price Prediction for 2025-2030
2025 Outlook
- Conservative prediction: $0.02947 - $0.05081
- Neutral prediction: $0.05081 - $0.05411
- Optimistic prediction: $0.05411 - $0.05742 (requires favorable market conditions)
2027-2028 Outlook
- Market phase expectation: Potential growth phase with increased volatility
- Price range forecast:
- 2027: $0.05536 - $0.0619
- 2028: $0.04068 - $0.07346
- Key catalysts: Wider adoption of FORT, technological advancements, and overall crypto market trends
2029-2030 Long-term Outlook
- Base scenario: $0.06709 - $0.07984 (assuming steady market growth)
- Optimistic scenario: $0.07984 - $0.09258 (assuming accelerated adoption and favorable market conditions)
- Transformative scenario: $0.09258 - $0.0998 (assuming breakthrough use cases and strong bullish market)
- 2030-12-31: FORT $0.07984 (potential year-end price based on average predictions)
| 年份 | 预测最高价 | 预测平均价格 | 预测最低价 | 涨跌幅 |
|---|---|---|---|---|
| 2025 | 0.05742 | 0.05081 | 0.02947 | 0 |
| 2026 | 0.06494 | 0.05411 | 0.03301 | 6 |
| 2027 | 0.0619 | 0.05952 | 0.05536 | 17 |
| 2028 | 0.07346 | 0.06071 | 0.04068 | 19 |
| 2029 | 0.09258 | 0.06709 | 0.05971 | 32 |
| 2030 | 0.0998 | 0.07984 | 0.0495 | 57 |
IV. Professional Investment Strategies and Risk Management for FORT
FORT Investment Methodology
(1) Long-term Holding Strategy
- Suitable for: Risk-tolerant investors with a long-term horizon
- Operation suggestions:
- Accumulate FORT tokens during market dips
- Set price targets for partial profit-taking
- Store tokens in secure non-custodial wallets
(2) Active Trading Strategy
- Technical analysis tools:
- Moving Averages: Use for trend identification and support/resistance levels
- RSI (Relative Strength Index): Identify overbought/oversold conditions
- Key points for swing trading:
- Monitor Forta network adoption and partnerships
- Track overall crypto market sentiment
FORT Risk Management Framework
(1) Asset Allocation Principles
- Conservative investors: 1-3% of crypto portfolio
- Moderate investors: 3-5% of crypto portfolio
- Aggressive investors: 5-10% of crypto portfolio
(2) Risk Hedging Solutions
- Diversification: Spread investments across different blockchain projects
- Stop-loss orders: Set predetermined exit points to limit potential losses
(3) Secure Storage Solutions
- Hot wallet recommendation: Gate Web3 Wallet
- Cold storage solution: Hardware wallets for long-term holdings
- Security precautions: Use two-factor authentication, backup private keys securely
V. Potential Risks and Challenges for FORT
FORT Market Risks
- Volatility: Cryptocurrency market's inherent price fluctuations
- Competition: Emergence of rival blockchain security projects
- Adoption: Slow uptake of Forta's technology by blockchain projects
FORT Regulatory Risks
- Uncertain regulations: Evolving global cryptocurrency regulations
- Compliance issues: Potential challenges in meeting future regulatory requirements
- Cross-border restrictions: Varying legal status in different jurisdictions
FORT Technical Risks
- Smart contract vulnerabilities: Potential exploits in Forta's underlying code
- Scalability challenges: Ability to handle increased network load
- Blockchain interoperability: Challenges in supporting multiple blockchain networks
VI. Conclusion and Action Recommendations
FORT Investment Value Assessment
Forta (FORT) presents a unique value proposition in the blockchain security sector, with potential for long-term growth. However, short-term volatility and adoption challenges pose significant risks.
FORT Investment Recommendations
✅ Beginners: Consider small, long-term positions after thorough research ✅ Experienced investors: Implement dollar-cost averaging strategy with strict risk management ✅ Institutional investors: Evaluate FORT as part of a diversified blockchain technology portfolio
FORT Trading Participation Methods
- Spot trading: Buy and sell FORT tokens on Gate.com
- Staking: Participate in FORT staking programs if available
- DeFi integration: Explore decentralized finance opportunities involving FORT tokens
Cryptocurrency investments carry extremely high risks, and this article does not constitute investment advice. Investors should make decisions carefully based on their own risk tolerance and are advised to consult professional financial advisors. Never invest more than you can afford to lose.
FAQ
What crypto will 1000x prediction?
While predicting 1000x gains is speculative, emerging AI and Web3 projects like AiDoge, yPredict, and DeeLance show potential for explosive growth in 2025, driven by technological innovation and market adoption.
Will Forta Crypto go up?
Yes, Forta is expected to rise significantly. Projections suggest it could reach $0.207663 by 2030, representing substantial growth from current prices.
Can Fantom reach $1000?
It's highly unlikely. Fantom would need to gain over 350,000% to reach $1,000, which is not supported by current market projections or trends.
What is Fortinet's stock price prediction?
Fortinet's stock price is predicted to reach $103.79 to $159.91 by 2030. The forecast for tomorrow is $103.11, a 0.59% decrease.
Share
Content