2025 RAD Price Prediction: Analyzing Market Trends and Future Growth Potential for Radicle Token
Introduction: RAD's Market Position and Investment Value
Radicle (RAD), as a governance token for a Web3 native network for software collaboration, has been making significant strides since its inception in 2021. As of 2025, Radicle's market capitalization has reached $32,015,203, with a circulating supply of approximately 49,829,110 tokens, and a price hovering around $0.6425. This asset, often referred to as the "GitHub of Web3," is playing an increasingly crucial role in decentralized software development and collaboration.
This article will provide a comprehensive analysis of Radicle's price trends from 2025 to 2030, considering historical patterns, market supply and demand, ecosystem development, and macroeconomic factors to offer professional price predictions and practical investment strategies for investors.
I. RAD Price History Review and Current Market Status
RAD Historical Price Evolution Trajectory
- 2021: Initial launch, price reached all-time high of $27.61 on April 16
- 2023: Market downturn, price declined significantly
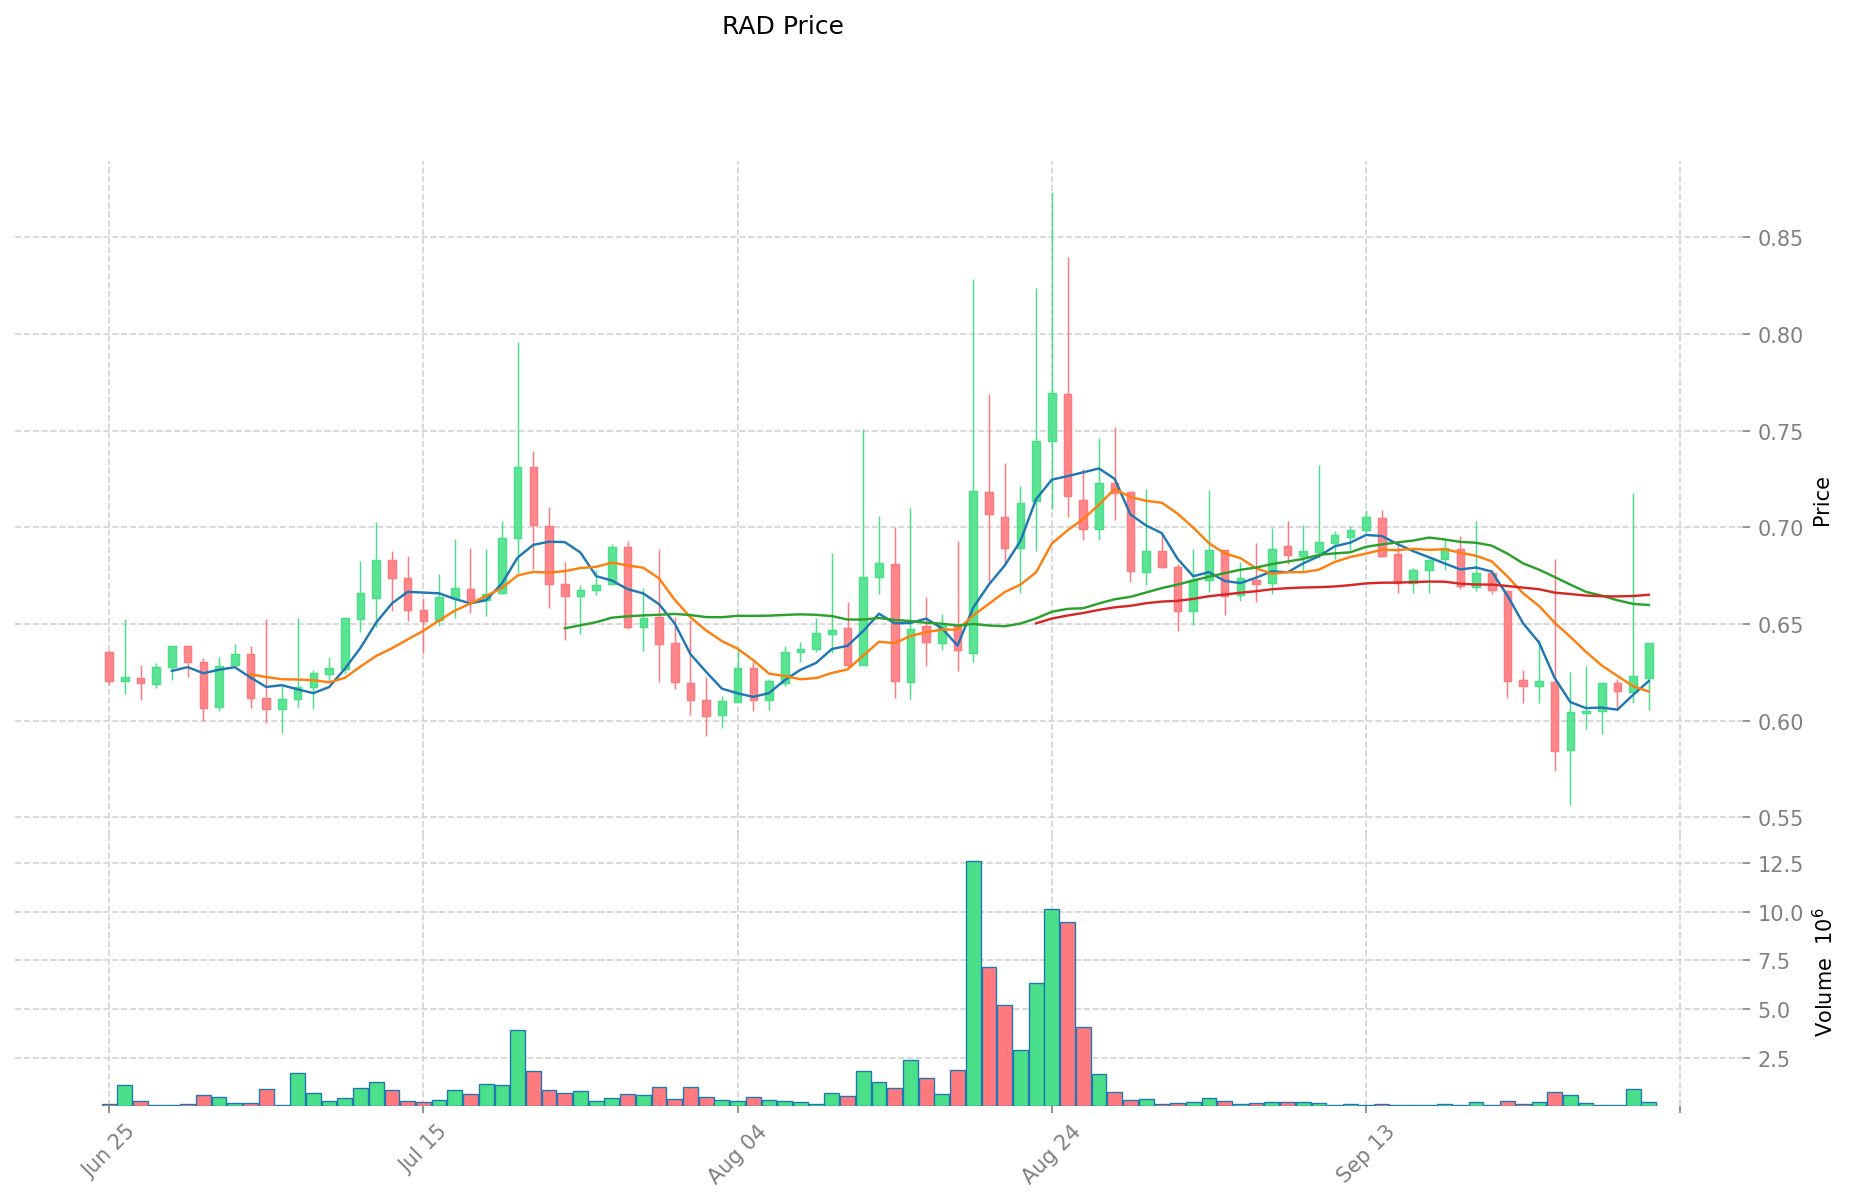
- 2025: Gradual recovery, price fluctuating between $0.56 and $0.64
RAD Current Market Situation
As of October 2, 2025, RAD is trading at $0.6425, with a 24-hour trading volume of $124,327. The token has seen a 3.81% increase in the last 24 hours. RAD's market capitalization stands at $32,015,203, ranking it 878th in the cryptocurrency market. The current price is 97.67% below its all-time high of $27.61, recorded on April 16, 2021. The token's circulating supply is 49,829,110 RAD, representing 49.83% of the total supply of 99,998,580 RAD.
Click to view the current RAD market price
RAD Market Sentiment Indicator
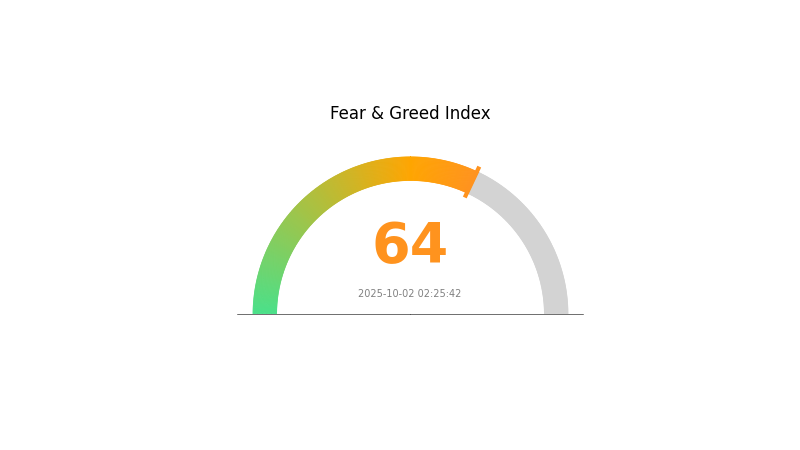
2025-10-02 Fear and Greed Index: 64 (Greed)
Click to view the current Fear & Greed Index
The cryptocurrency market is exhibiting signs of greed, with the Fear and Greed Index reaching 64. This suggests investors are becoming overly optimistic, potentially leading to inflated asset prices. While bullish sentiment can drive market growth, it's crucial to remain cautious. Traders should consider diversifying portfolios and setting stop-loss orders to protect gains. Remember, market sentiment can shift rapidly, so stay informed and adjust strategies accordingly. Gate.com offers tools to help navigate these market conditions effectively.
RAD Holdings Distribution
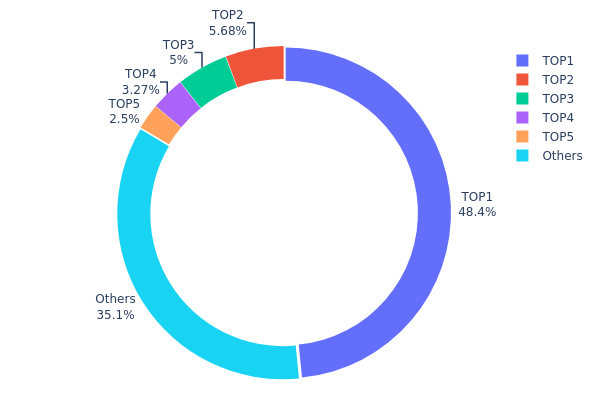
The address holdings distribution data for RAD reveals a highly concentrated ownership structure. The top address holds a staggering 48.42% of the total supply, equivalent to 48,422.60K RAD tokens. This significant concentration in a single address raises concerns about potential market manipulation and price volatility.
Following the top holder, the next four largest addresses collectively control 16.44% of the supply. Notably, the second and third largest holders possess 5.67% and 5.00% respectively, while the remaining two hold 3.27% and 2.50%. The remaining 35.14% is distributed among other addresses. This top-heavy distribution suggests a relatively low level of decentralization, which could impact the token's market dynamics and governance structure.
Such a concentrated holding pattern may lead to increased price volatility and susceptibility to large sell-offs if major holders decide to liquidate their positions. It also raises questions about the project's decentralization efforts and the potential for a small group of addresses to exert significant influence over the RAD ecosystem.
Click to view the current RAD Holdings Distribution
| Top | Address | Holding Qty | Holding (%) |
|---|---|---|---|
| 1 | 0x8da8...6130ba | 48422.60K | 48.42% |
| 2 | 0xf977...41acec | 5678.43K | 5.67% |
| 3 | 0x5a52...70efcb | 5000.00K | 5.00% |
| 4 | 0x2887...cd1992 | 3274.37K | 3.27% |
| 5 | 0xdacf...eb32e7 | 2500.00K | 2.50% |
| - | Others | 35123.19K | 35.14% |
II. Key Factors Affecting RAD's Future Price
Supply Mechanism
- Circulating Supply: The circulating supply directly impacts price fluctuations. An increase in RAD's circulating supply may exert downward pressure on the price, while a decrease could potentially support price appreciation.
Macroeconomic Environment
-
Currency Policy Impact: The U.S. Dollar Index and exchange rates are significant factors influencing RAD's future price development.
-
Inflation Hedging Properties: In an inflationary environment, RAD's performance as a potential hedge against inflation could impact its price.
Technical Development and Ecosystem Building
-
Blockchain Technology Trends: The development trends in blockchain technology can provide a solid foundation for RAD's future growth and price performance.
-
Ecosystem Applications: The growth and adoption of decentralized applications (DApps) and other ecosystem projects built on the RAD network could significantly influence its value proposition and price.
III. RAD Price Prediction for 2025-2030
2025 Outlook
- Conservative prediction: $0.56 - $0.64
- Neutral prediction: $0.64 - $0.74
- Optimistic prediction: $0.74 - $0.84 (requires favorable market conditions)
2027-2028 Outlook
- Market phase expectation: Potential growth phase
- Price range forecast:
- 2027: $0.71 - $0.96
- 2028: $0.54 - $1.28
- Key catalysts: Technological advancements and increased adoption
2029-2030 Long-term Outlook
- Base scenario: $1.09 - $1.27 (assuming steady market growth)
- Optimistic scenario: $1.27 - $1.77 (assuming strong market performance)
- Transformative scenario: $1.77+ (assuming exceptional market conditions and widespread adoption)
- 2030-12-31: RAD $1.77 (potential peak price)
| 年份 | 预测最高价 | 预测平均价格 | 预测最低价 | 涨跌幅 |
|---|---|---|---|---|
| 2025 | 0.83932 | 0.6407 | 0.56382 | 0 |
| 2026 | 0.96201 | 0.74001 | 0.56241 | 15 |
| 2027 | 0.96164 | 0.85101 | 0.71485 | 32 |
| 2028 | 1.27792 | 0.90633 | 0.5438 | 41 |
| 2029 | 1.4416 | 1.09212 | 0.63343 | 69 |
| 2030 | 1.77361 | 1.26686 | 1.01349 | 97 |
IV. RAD Professional Investment Strategies and Risk Management
RAD Investment Methodology
(1) Long-term Holding Strategy
- Suitable for: Risk-tolerant investors with a long-term outlook
- Operational suggestions:
- Accumulate RAD tokens during market dips
- Set price alerts for significant market movements
- Store tokens securely in a hardware wallet
(2) Active Trading Strategy
- Technical analysis tools:
- Moving Averages: Use to identify trends and potential reversal points
- Relative Strength Index (RSI): Gauge overbought or oversold conditions
- Key points for swing trading:
- Monitor trading volume for confirmation of price movements
- Set stop-loss orders to manage downside risk
RAD Risk Management Framework
(1) Asset Allocation Principles
- Conservative investors: 1-3% of crypto portfolio
- Aggressive investors: 5-10% of crypto portfolio
- Professional investors: Up to 15% of crypto portfolio
(2) Risk Hedging Solutions
- Diversification: Spread investments across various crypto assets
- Stop-loss orders: Implement to limit potential losses
(3) Secure Storage Solutions
- Hot wallet recommendation: Gate Web3 Wallet
- Cold storage solution: Hardware wallet for long-term holdings
- Security precautions: Enable two-factor authentication, use strong passwords
V. Potential Risks and Challenges for RAD
RAD Market Risks
- High volatility: RAD price can experience significant fluctuations
- Limited liquidity: May face challenges in executing large trades
- Correlation with broader crypto market: Susceptible to overall market trends
RAD Regulatory Risks
- Uncertain regulatory landscape: Potential for new regulations affecting token governance
- Cross-border compliance: Challenges in adhering to diverse international regulations
- Taxation complexities: Evolving tax laws may impact token holders
RAD Technical Risks
- Smart contract vulnerabilities: Potential for exploits in the underlying code
- Network congestion: Ethereum-based transactions may face delays or high fees
- Technological obsolescence: Risk of being outpaced by newer blockchain solutions
VI. Conclusion and Action Recommendations
RAD Investment Value Assessment
RAD offers potential long-term value as a governance token in the decentralized software development space. However, short-term volatility and regulatory uncertainties pose significant risks.
RAD Investment Recommendations
✅ Beginners: Consider small, regular investments to build a position over time ✅ Experienced investors: Implement dollar-cost averaging strategy with strict risk management ✅ Institutional investors: Conduct thorough due diligence and consider RAD as part of a diversified crypto portfolio
RAD Trading Participation Methods
- Spot trading: Available on Gate.com for direct RAD/USDT trades
- Limit orders: Set buy and sell orders at specific price points
- DCA (Dollar-Cost Averaging): Regular, fixed-amount purchases to mitigate volatility risk
Cryptocurrency investments carry extremely high risks, and this article does not constitute investment advice. Investors should make prudent decisions based on their own risk tolerance and are advised to consult professional financial advisors. Never invest more than you can afford to lose.
FAQ
What is the price prediction for rad in 2025?
Based on current market trends, Radicle (RAD) is predicted to reach a price range of $0.87 to $3.78 by 2025. This forecast reflects potential growth in the Web3 ecosystem.
What is the price prediction for rad crypto in 2030?
Based on historical data analysis, the price prediction for Radicle (RAD) in 2030 is $53.37. This represents a significant 86.02 times increase from its current price.
What is Nvidia's price prediction for 2025?
Based on current forecasts, Nvidia's stock price is expected to reach $200.52 per share by October 30, 2025, representing a 7.47% increase from current levels.
What is the XRP price prediction in 2025?
Based on current market trends and analysis, XRP price is predicted to reach around $1.50 to $2.00 by the end of 2025, showing potential for significant growth.
Share
Content