Application of MACD - the King of Indicators
This "Gate Learn Futures" intermediate course introduces concepts and the use of various technical indicators, including candlestick charts, technical patterns, moving averages, and trend lines. This article will introduce the concept of MACD, known as the king of indicators, including elaborating on its basis, technical meaning, and application in trading.
Why is MACD the King of Indicators?
The MACD is considered the primary indicator for futures traders and is an essential, entry-level method for investors beginning to learn indicator analysis. As one of the most classic indicators and due to its prominence within the technical indicators system, the MACD is often referred to as the “king of indicators.”
Why is MACD important ?
- It is the most used indicator and is proven to be the most effective and practical indicator in reflecting the market trend.
- It is an oscillating indicator calculated from the moving average indicator EMA, thus it works well both for predicting market trends and analyzing oscillating markets.
- The divergence of the MACD indicator is considered to be one of the best technical analysis methods to help traders “buy at the bottom and sell at the top” .
- The MACD is one of the most widely used indicators for determining the optimal times to open and close positions. It is commonly employed to gauge the timing of buying and selling assets and evaluate the balance of long and short forces in the market.
What is the MACD indicator?
MACD is short for Moving Average Convergence Divergence, and is called “指数平滑异同移动平均线” in Chinese。 It was introduced by Gerald Apple (Gerald Apple).
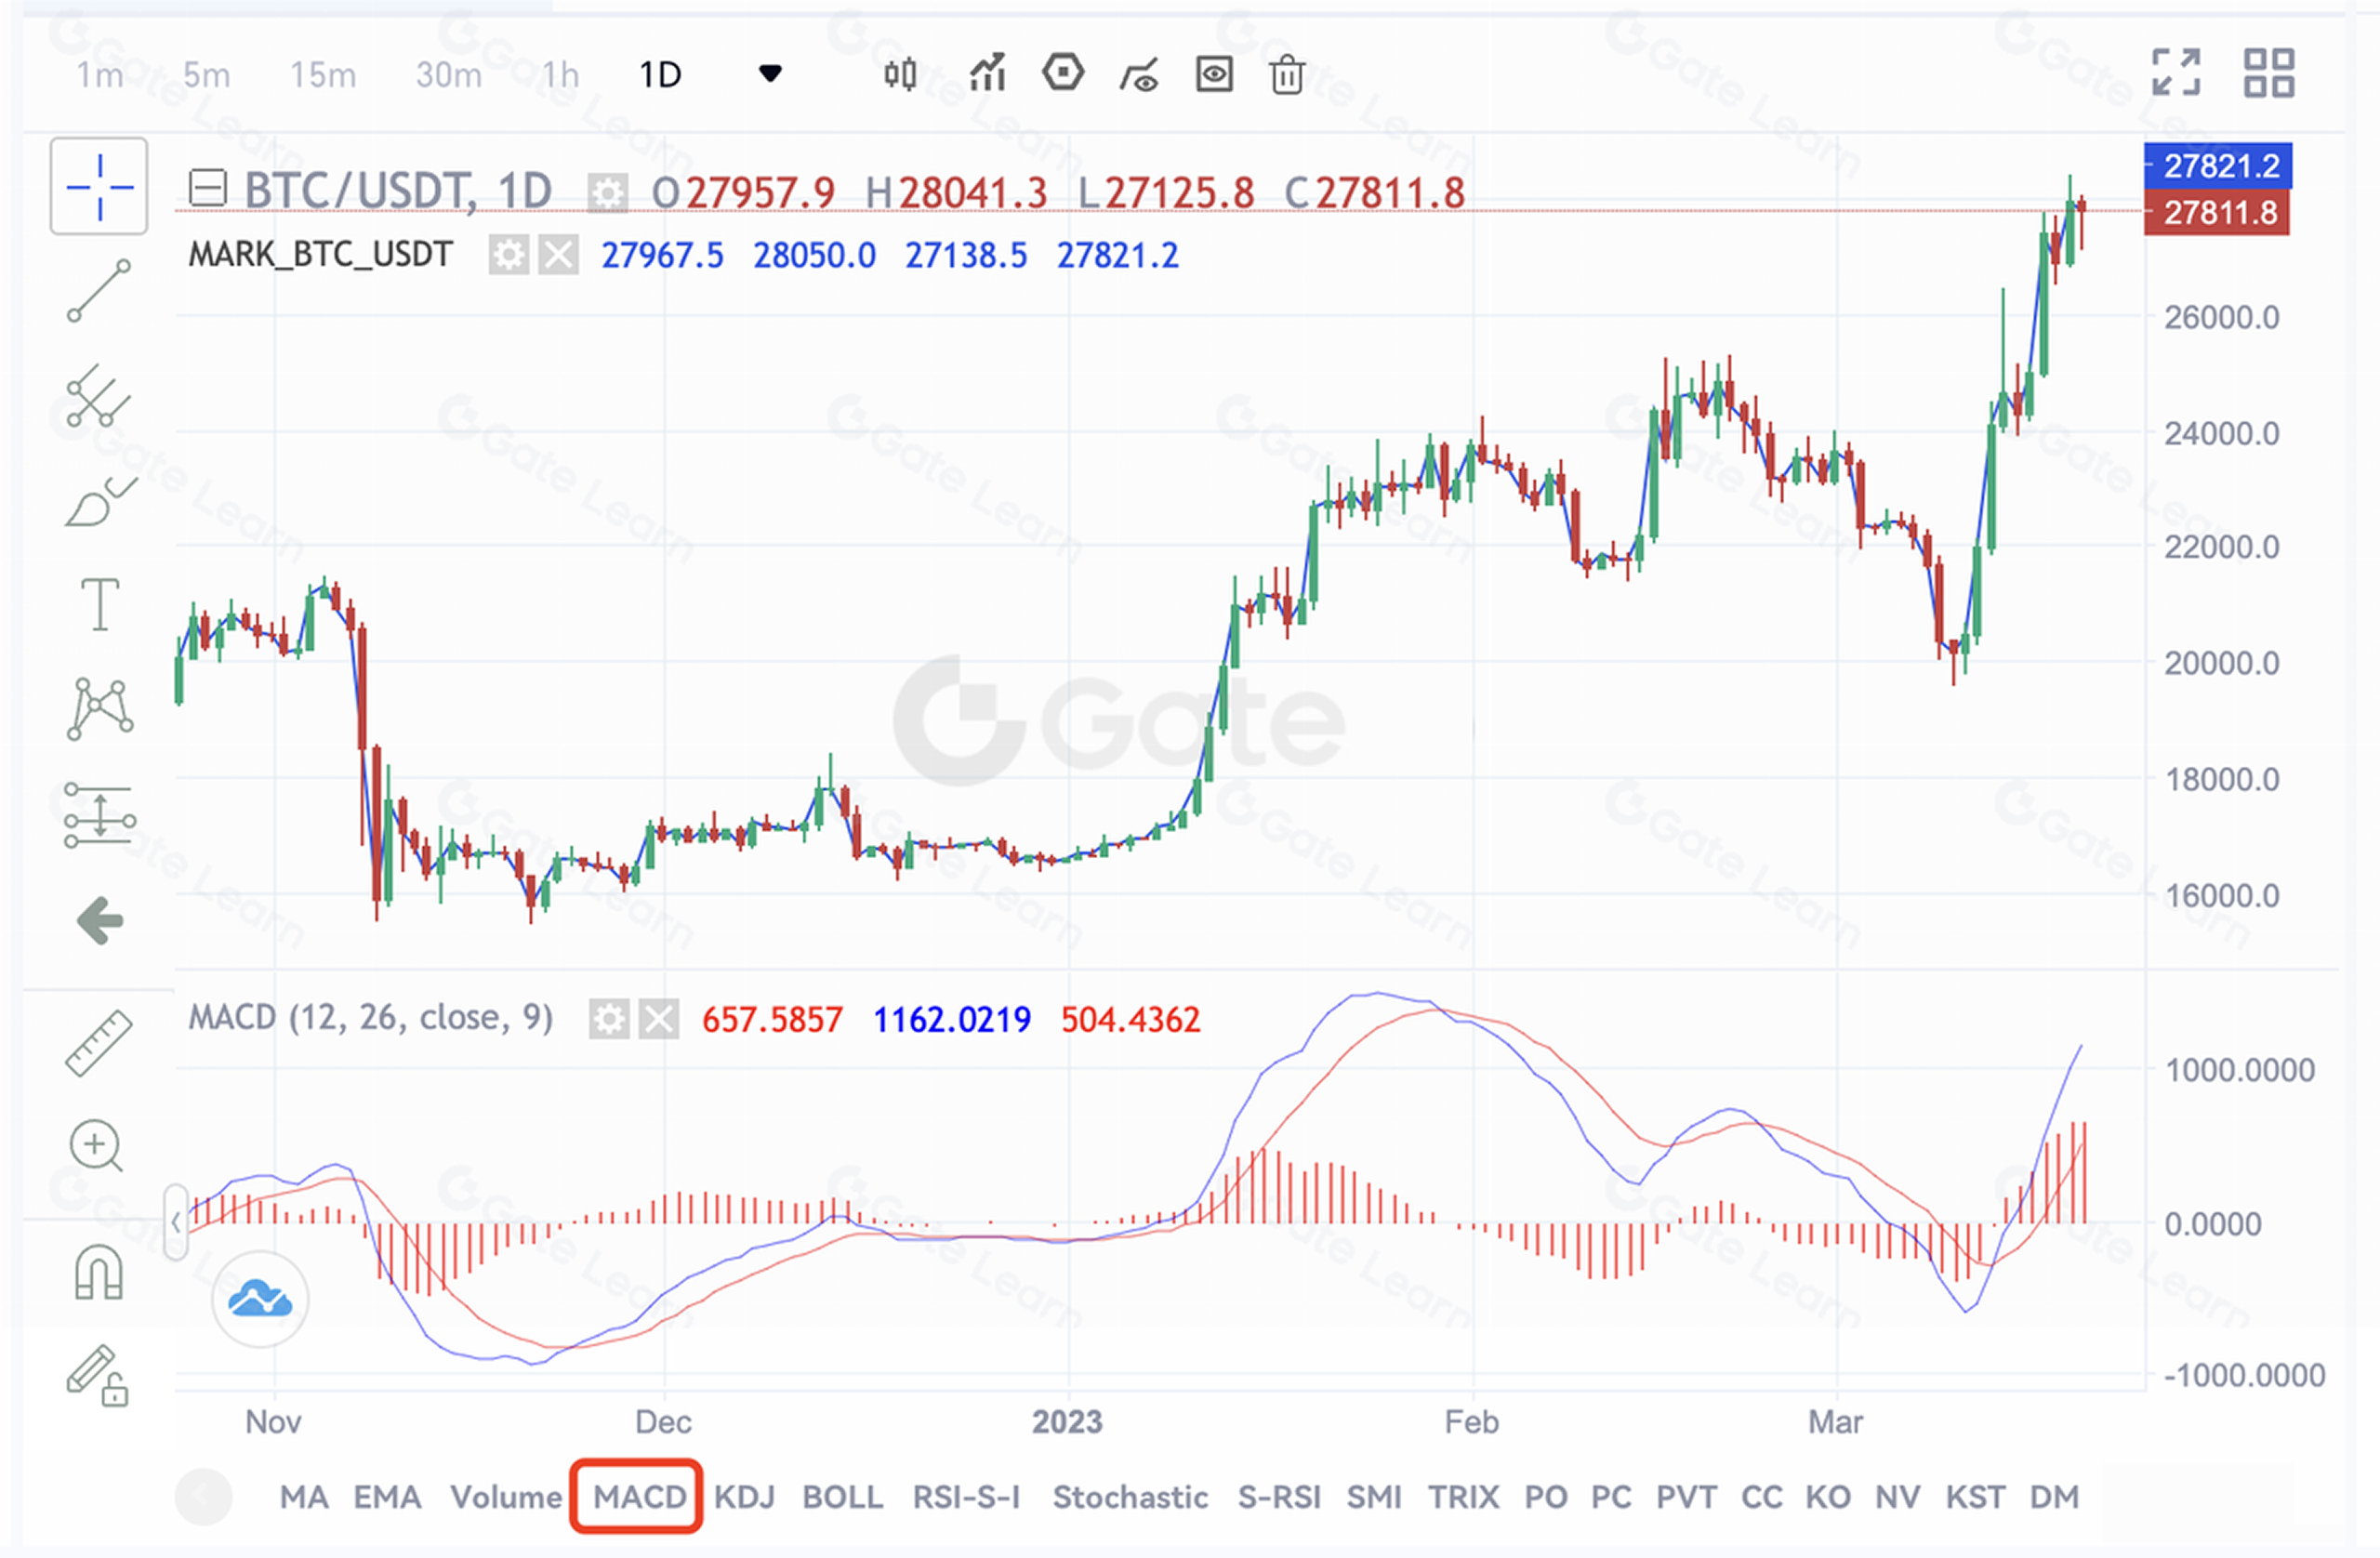
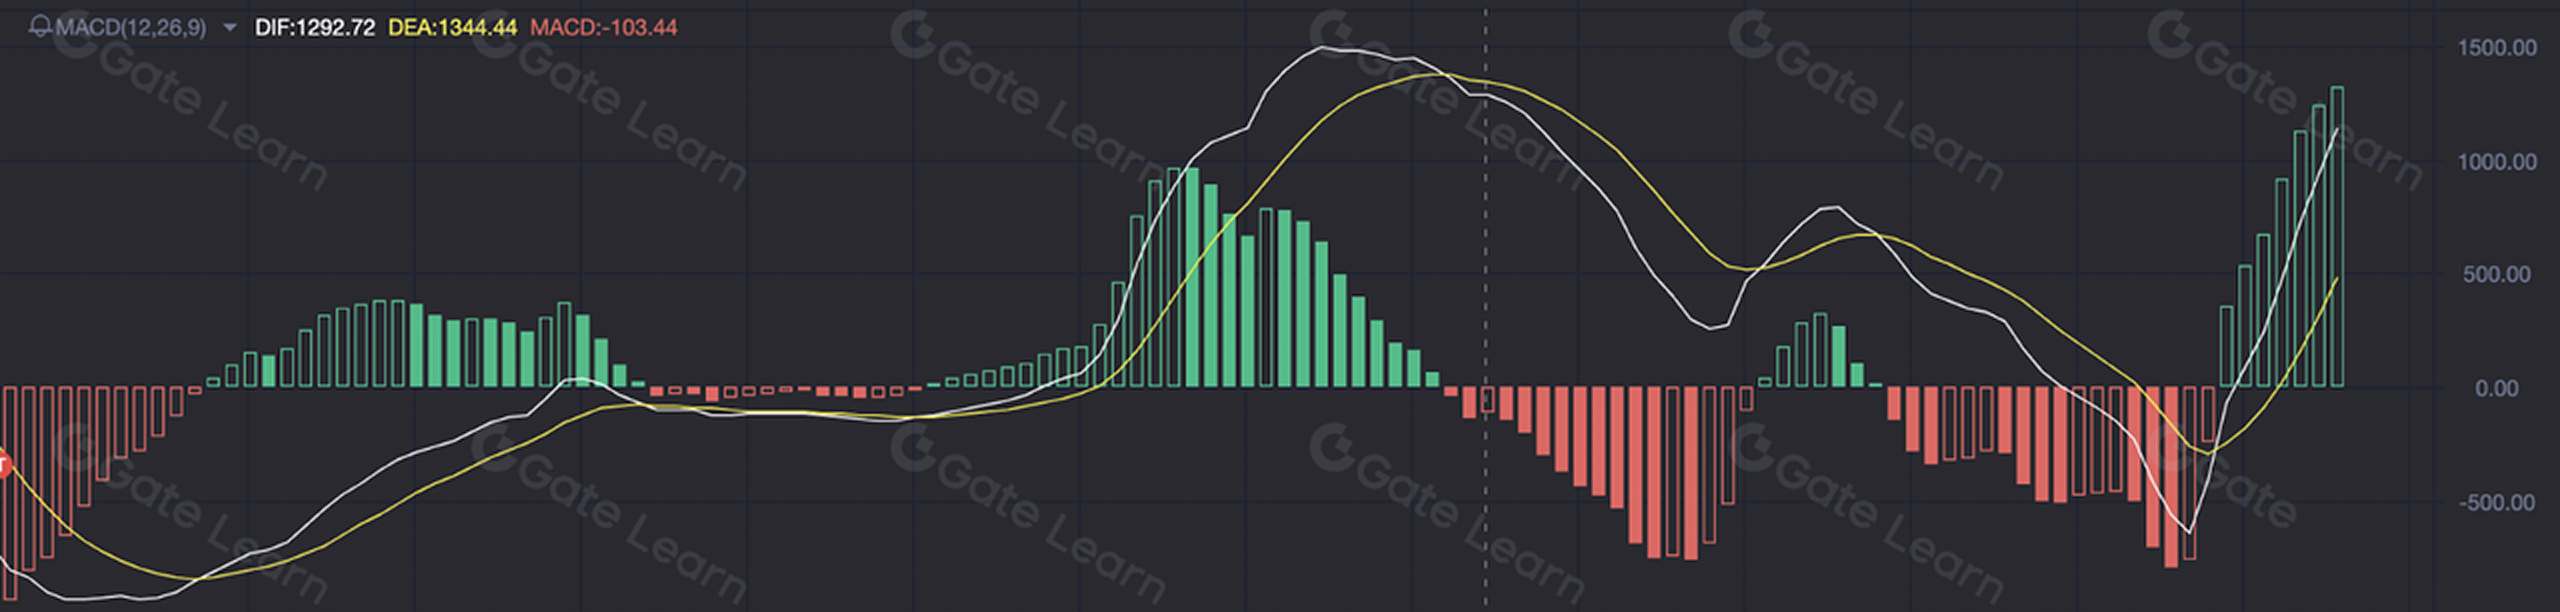
The MACD indicator consists of three values, namely, DIF (difference value), DEA (average difference value) and BAR (column line). Taking the figure below as an example, DIF is the white line, also known as the “fast line”. DEA, also called the “slow line”, is the yellow line. The initial version of MACD only consists of these two lines, and from how the two lines draw to or depart from each other, one can judge the moving trend of the market.
The third element, the columnar line (BAR), was added to the indicator at later stages, when the application of MACD grew in popularity. The columnar line (BAR), commonly known as “red and green columns”, does not represent any material value. It helps traders observe the relative distance of two other lines and merely plays an auxiliary role in the subsequent analysis.
Application
( 1) DIF and DEA value and their relative positions
- When both DIF and DEA are greater than 0 (on the 0 axis) and move upward - the market is in a bullish trend and it is time for traders to maintain or increase their positions.
- When both DIF and DEA are less than 0 (below the 0 axis) and move downward - the selling force is dominant and traders are suggested to sell assets or maintain a “wait and see” attitude.
- When both DIF and DEA are greater than 0 (on the 0 axis) but both move downward - the bull market is down and the bearish trend is imminent, so it is time to sell assets or wait and see.
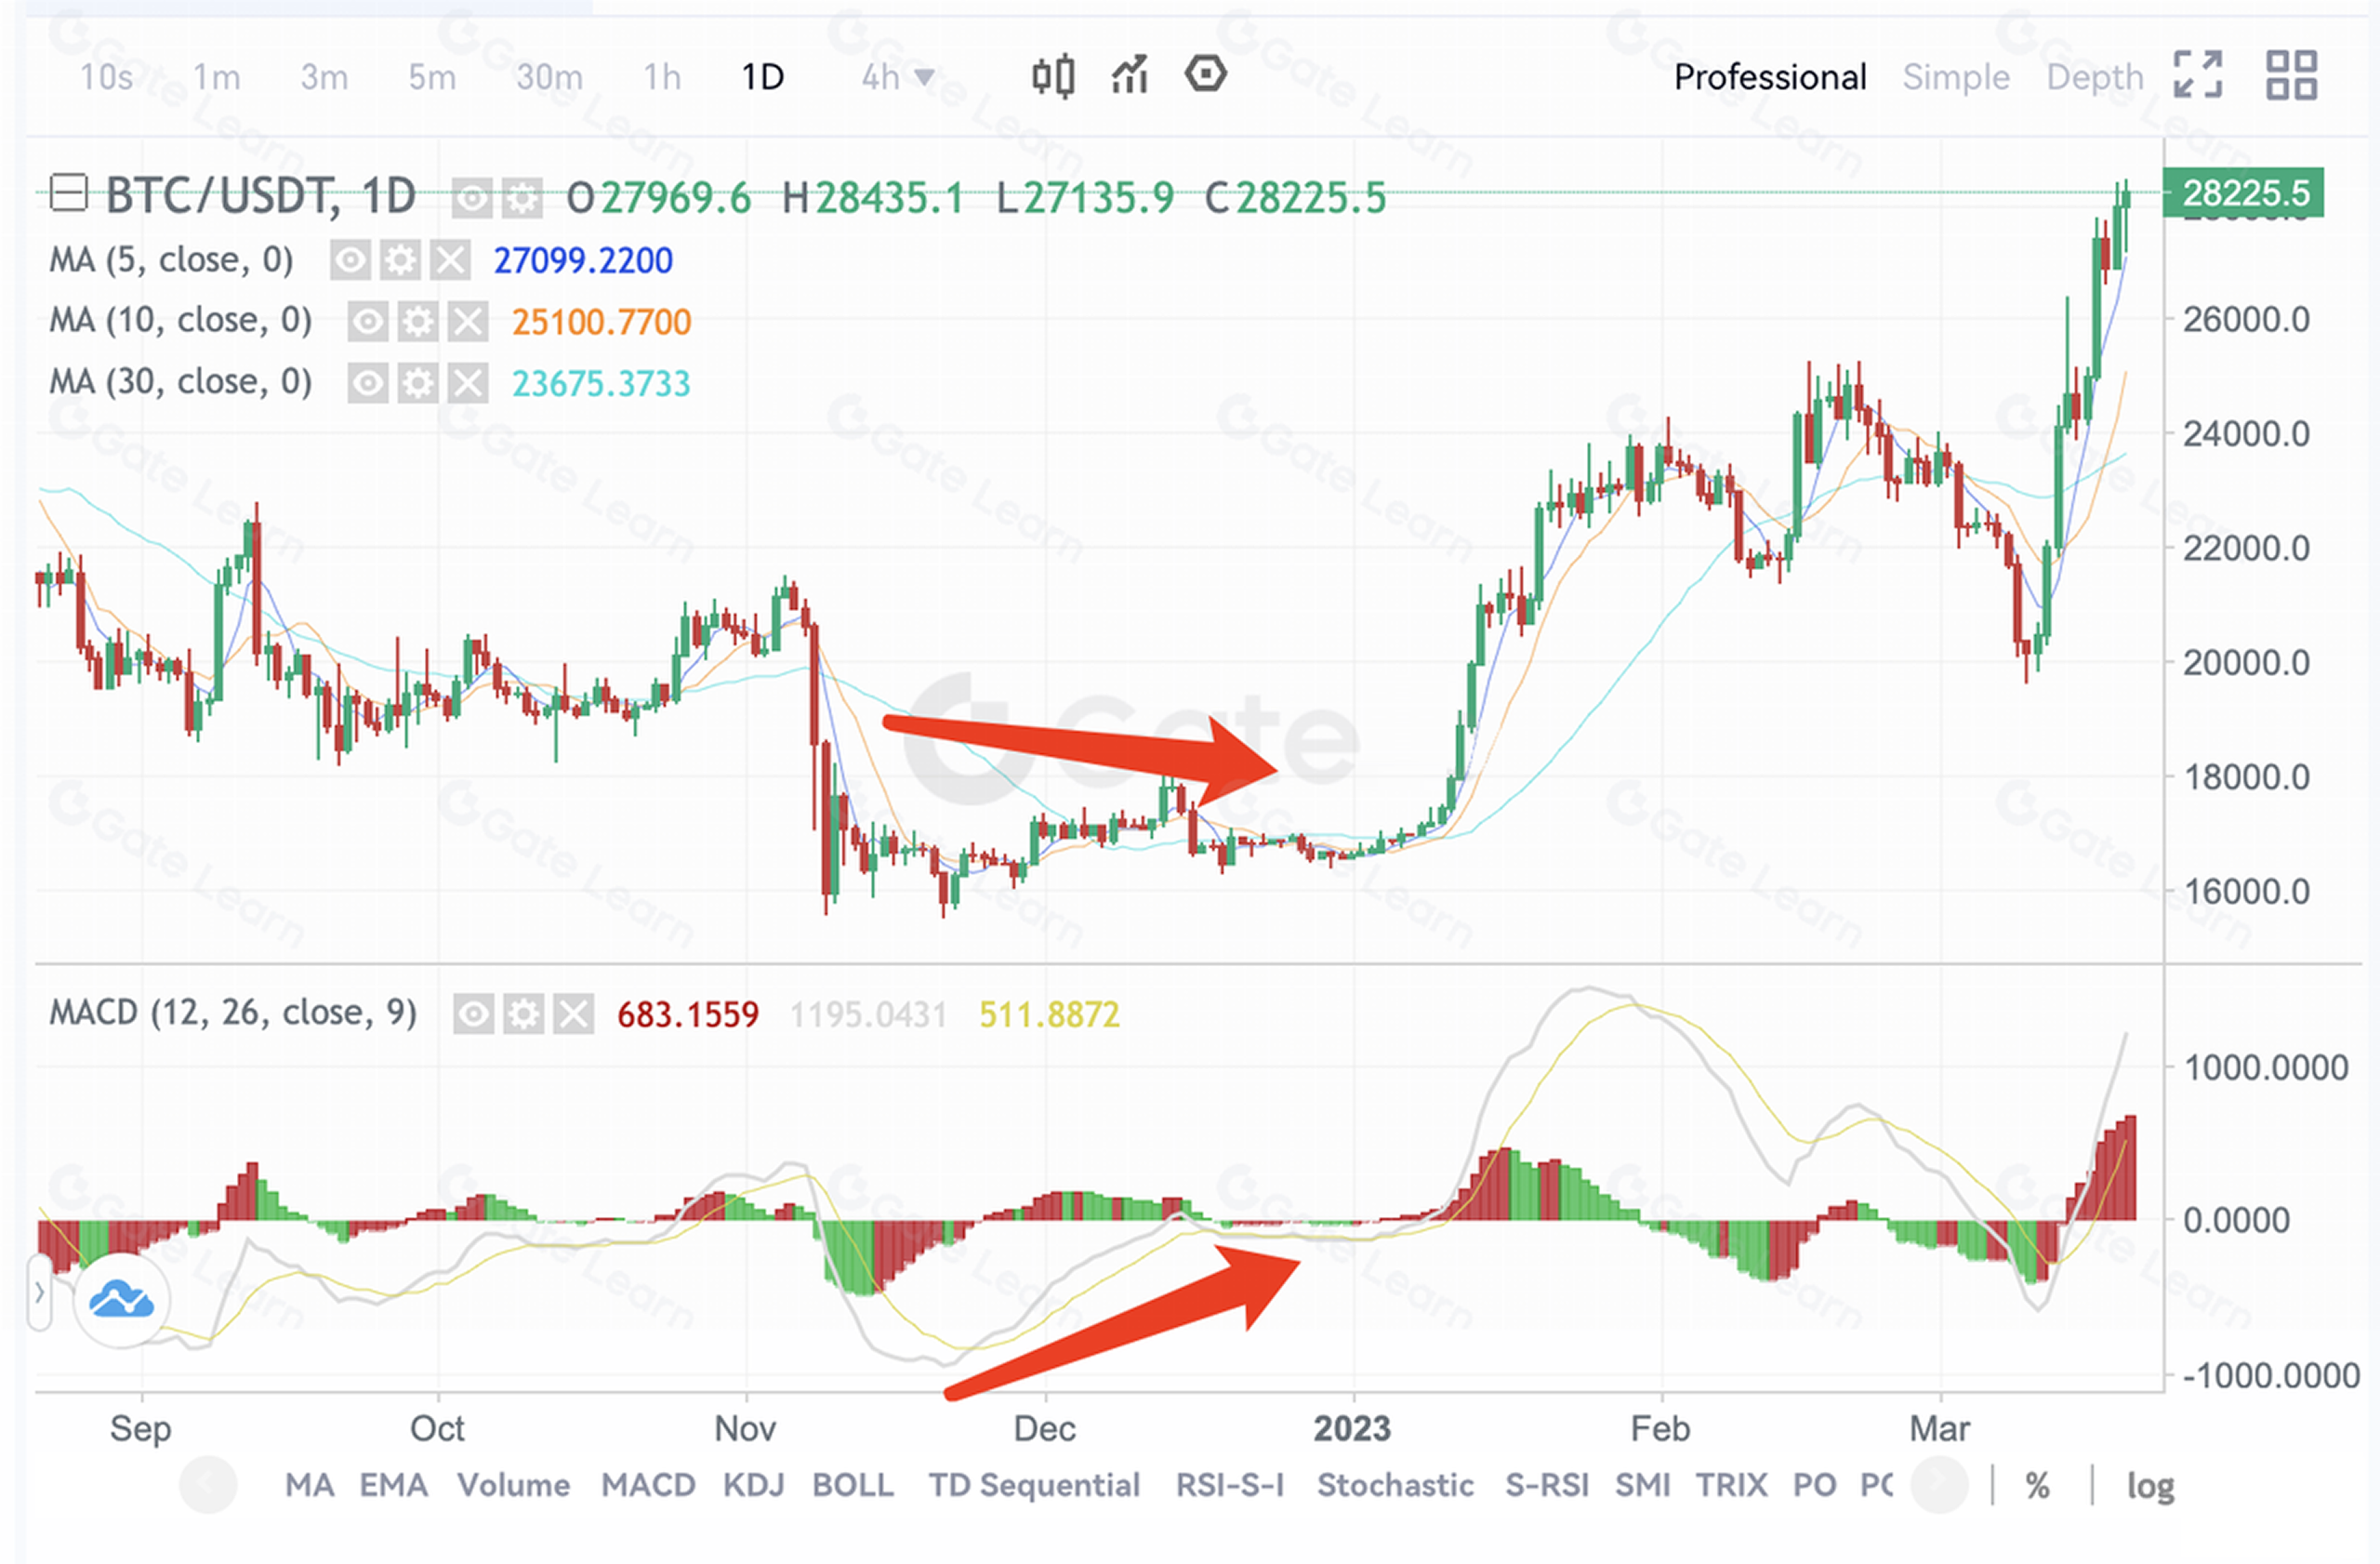
- When both DIF and DEA are less than 0 (below the 0 axis) but move upward - the market is about to rise, so traders choose either to hold to their current assets or buy more assets.
( 2) When DIF and DEA cross
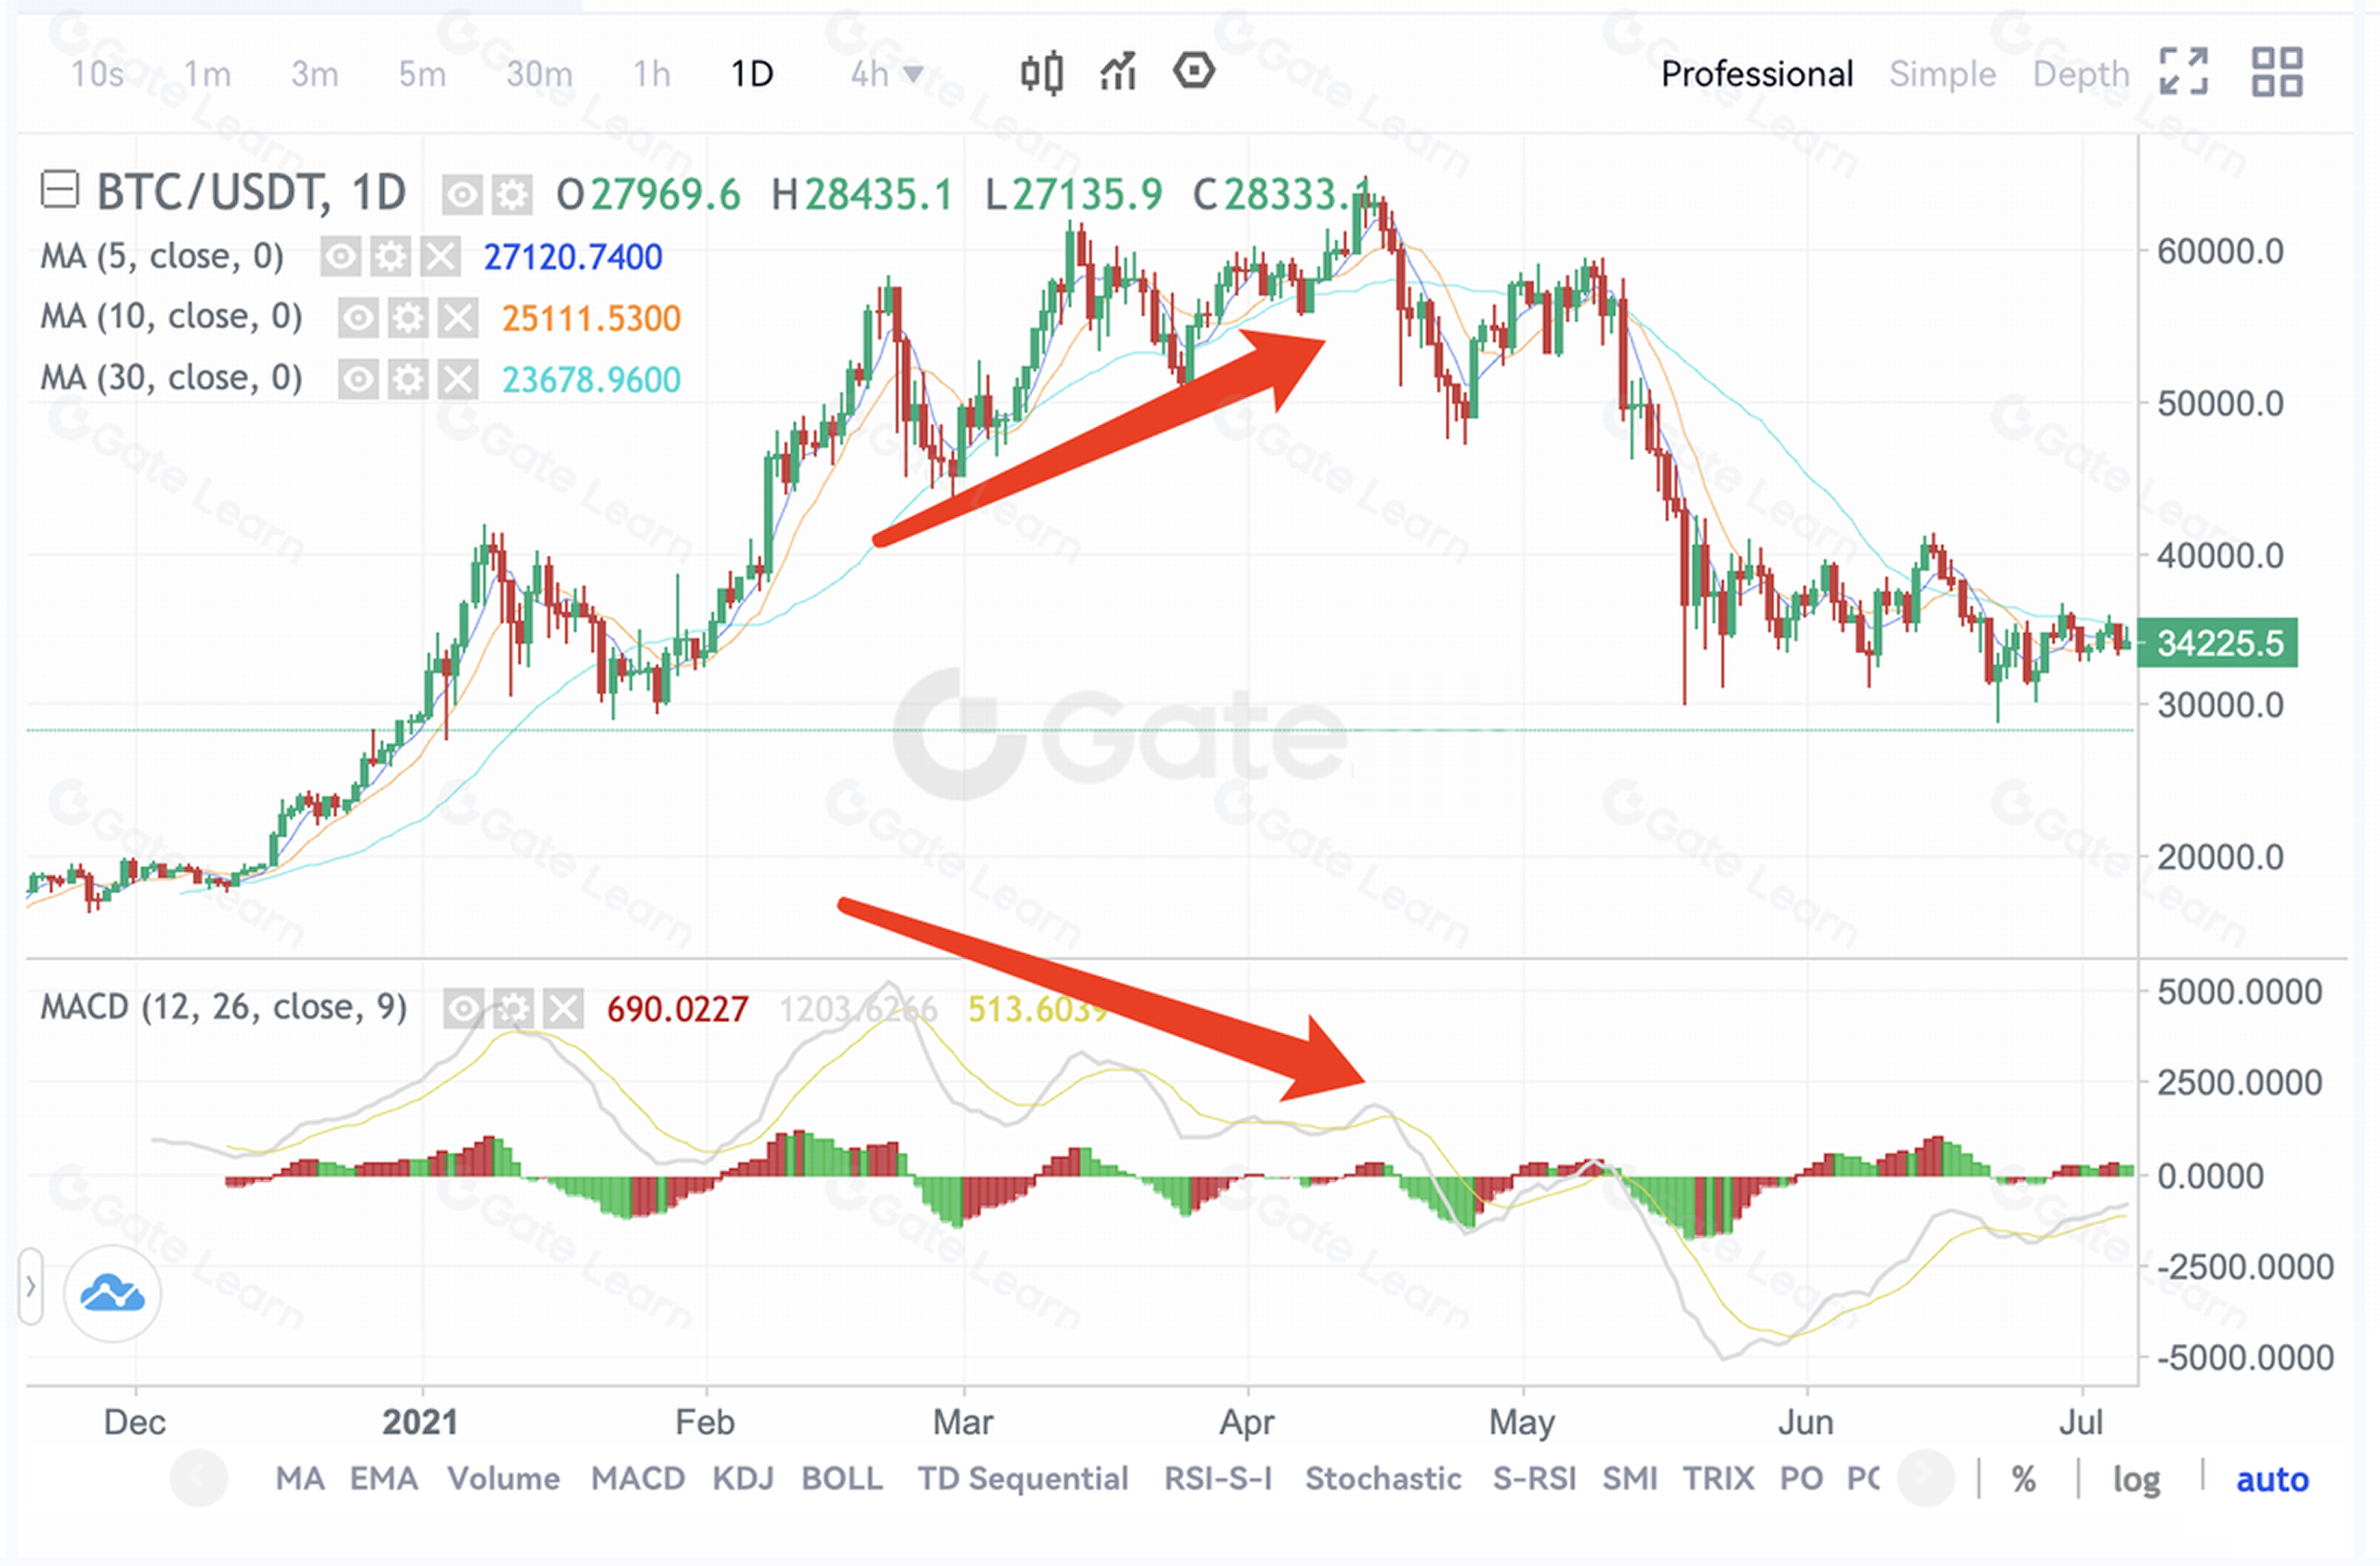
1.When both DIF and DEA are above the 0 axis, and DIF goes up to break through DEA - the market is buoyant, and the currency price will rise again. Traders can invest more assets or maintain their current positions to wait for assets to gain in value. The cross formed by the two lines is known as MACD golden cross. As shown below:
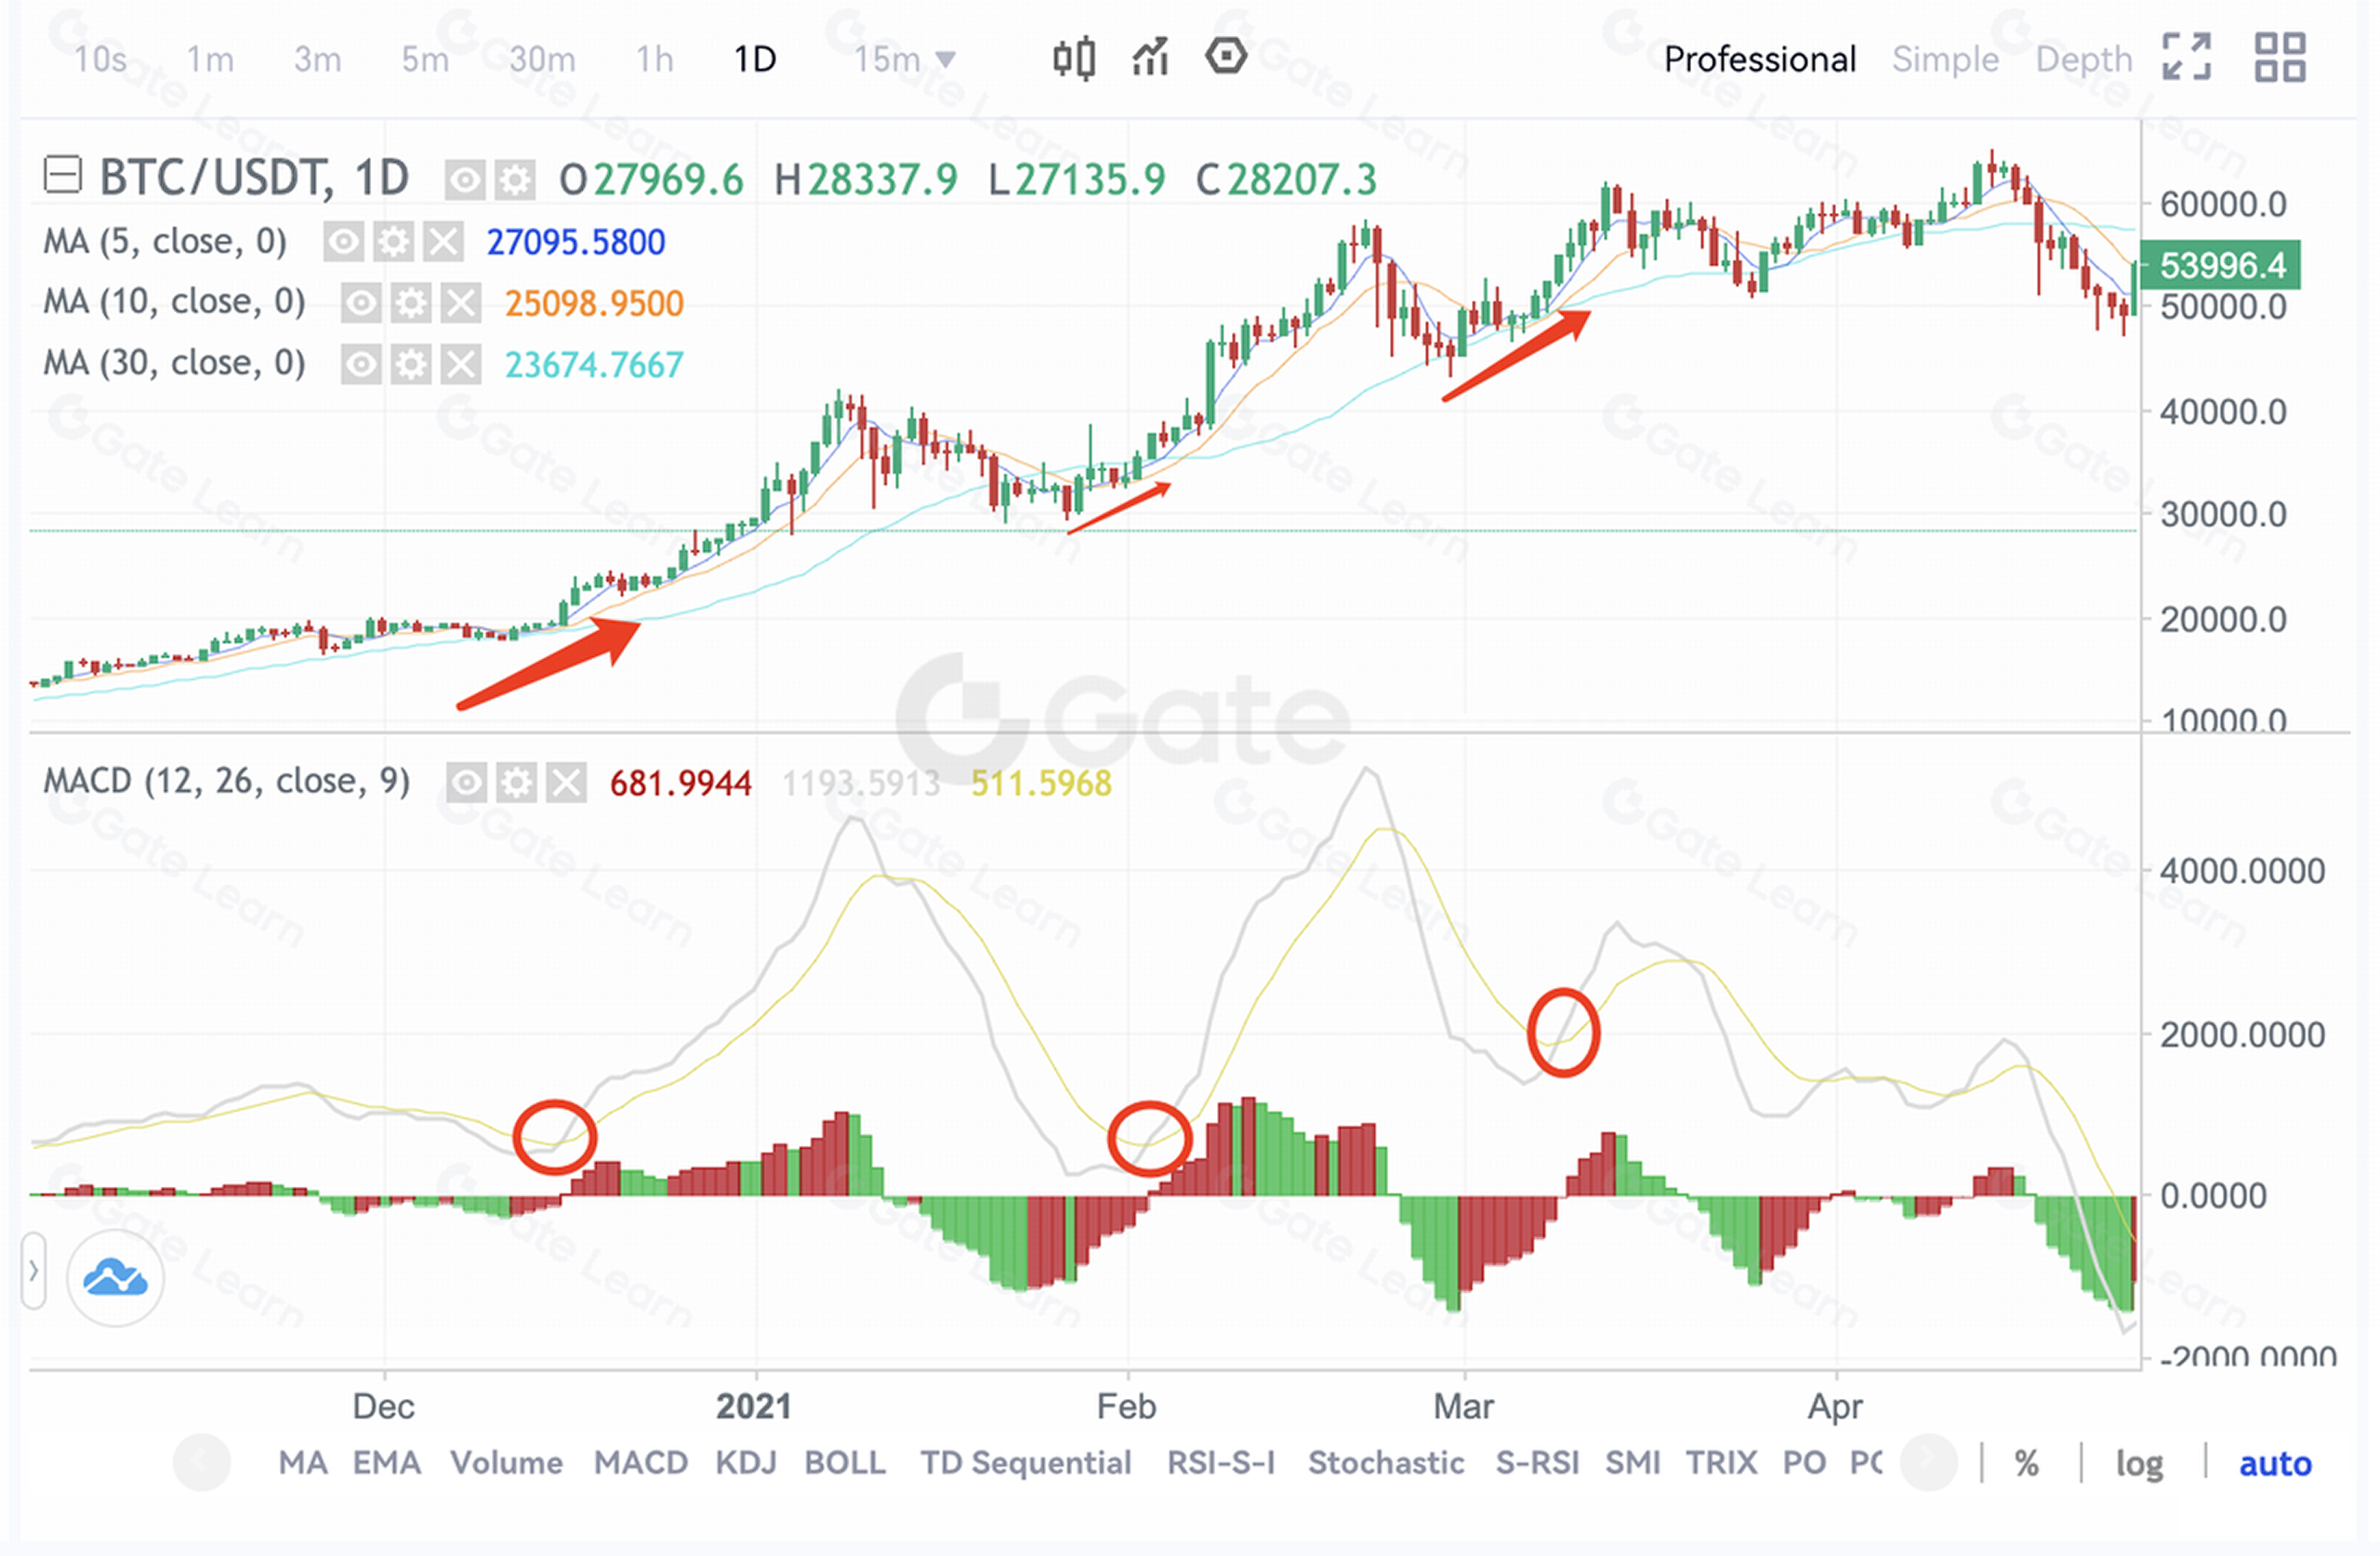
2.When both DIF and DEA are below the 0 axis, and DIF goes up to break through DEA - the market is about to pick up and price will stop falling and rebound back up. This is a good time for traders to buy more assets or to hold current positions. Such a cross, formed by intersection of the lines is another form of MACD golden cross. As shown below:
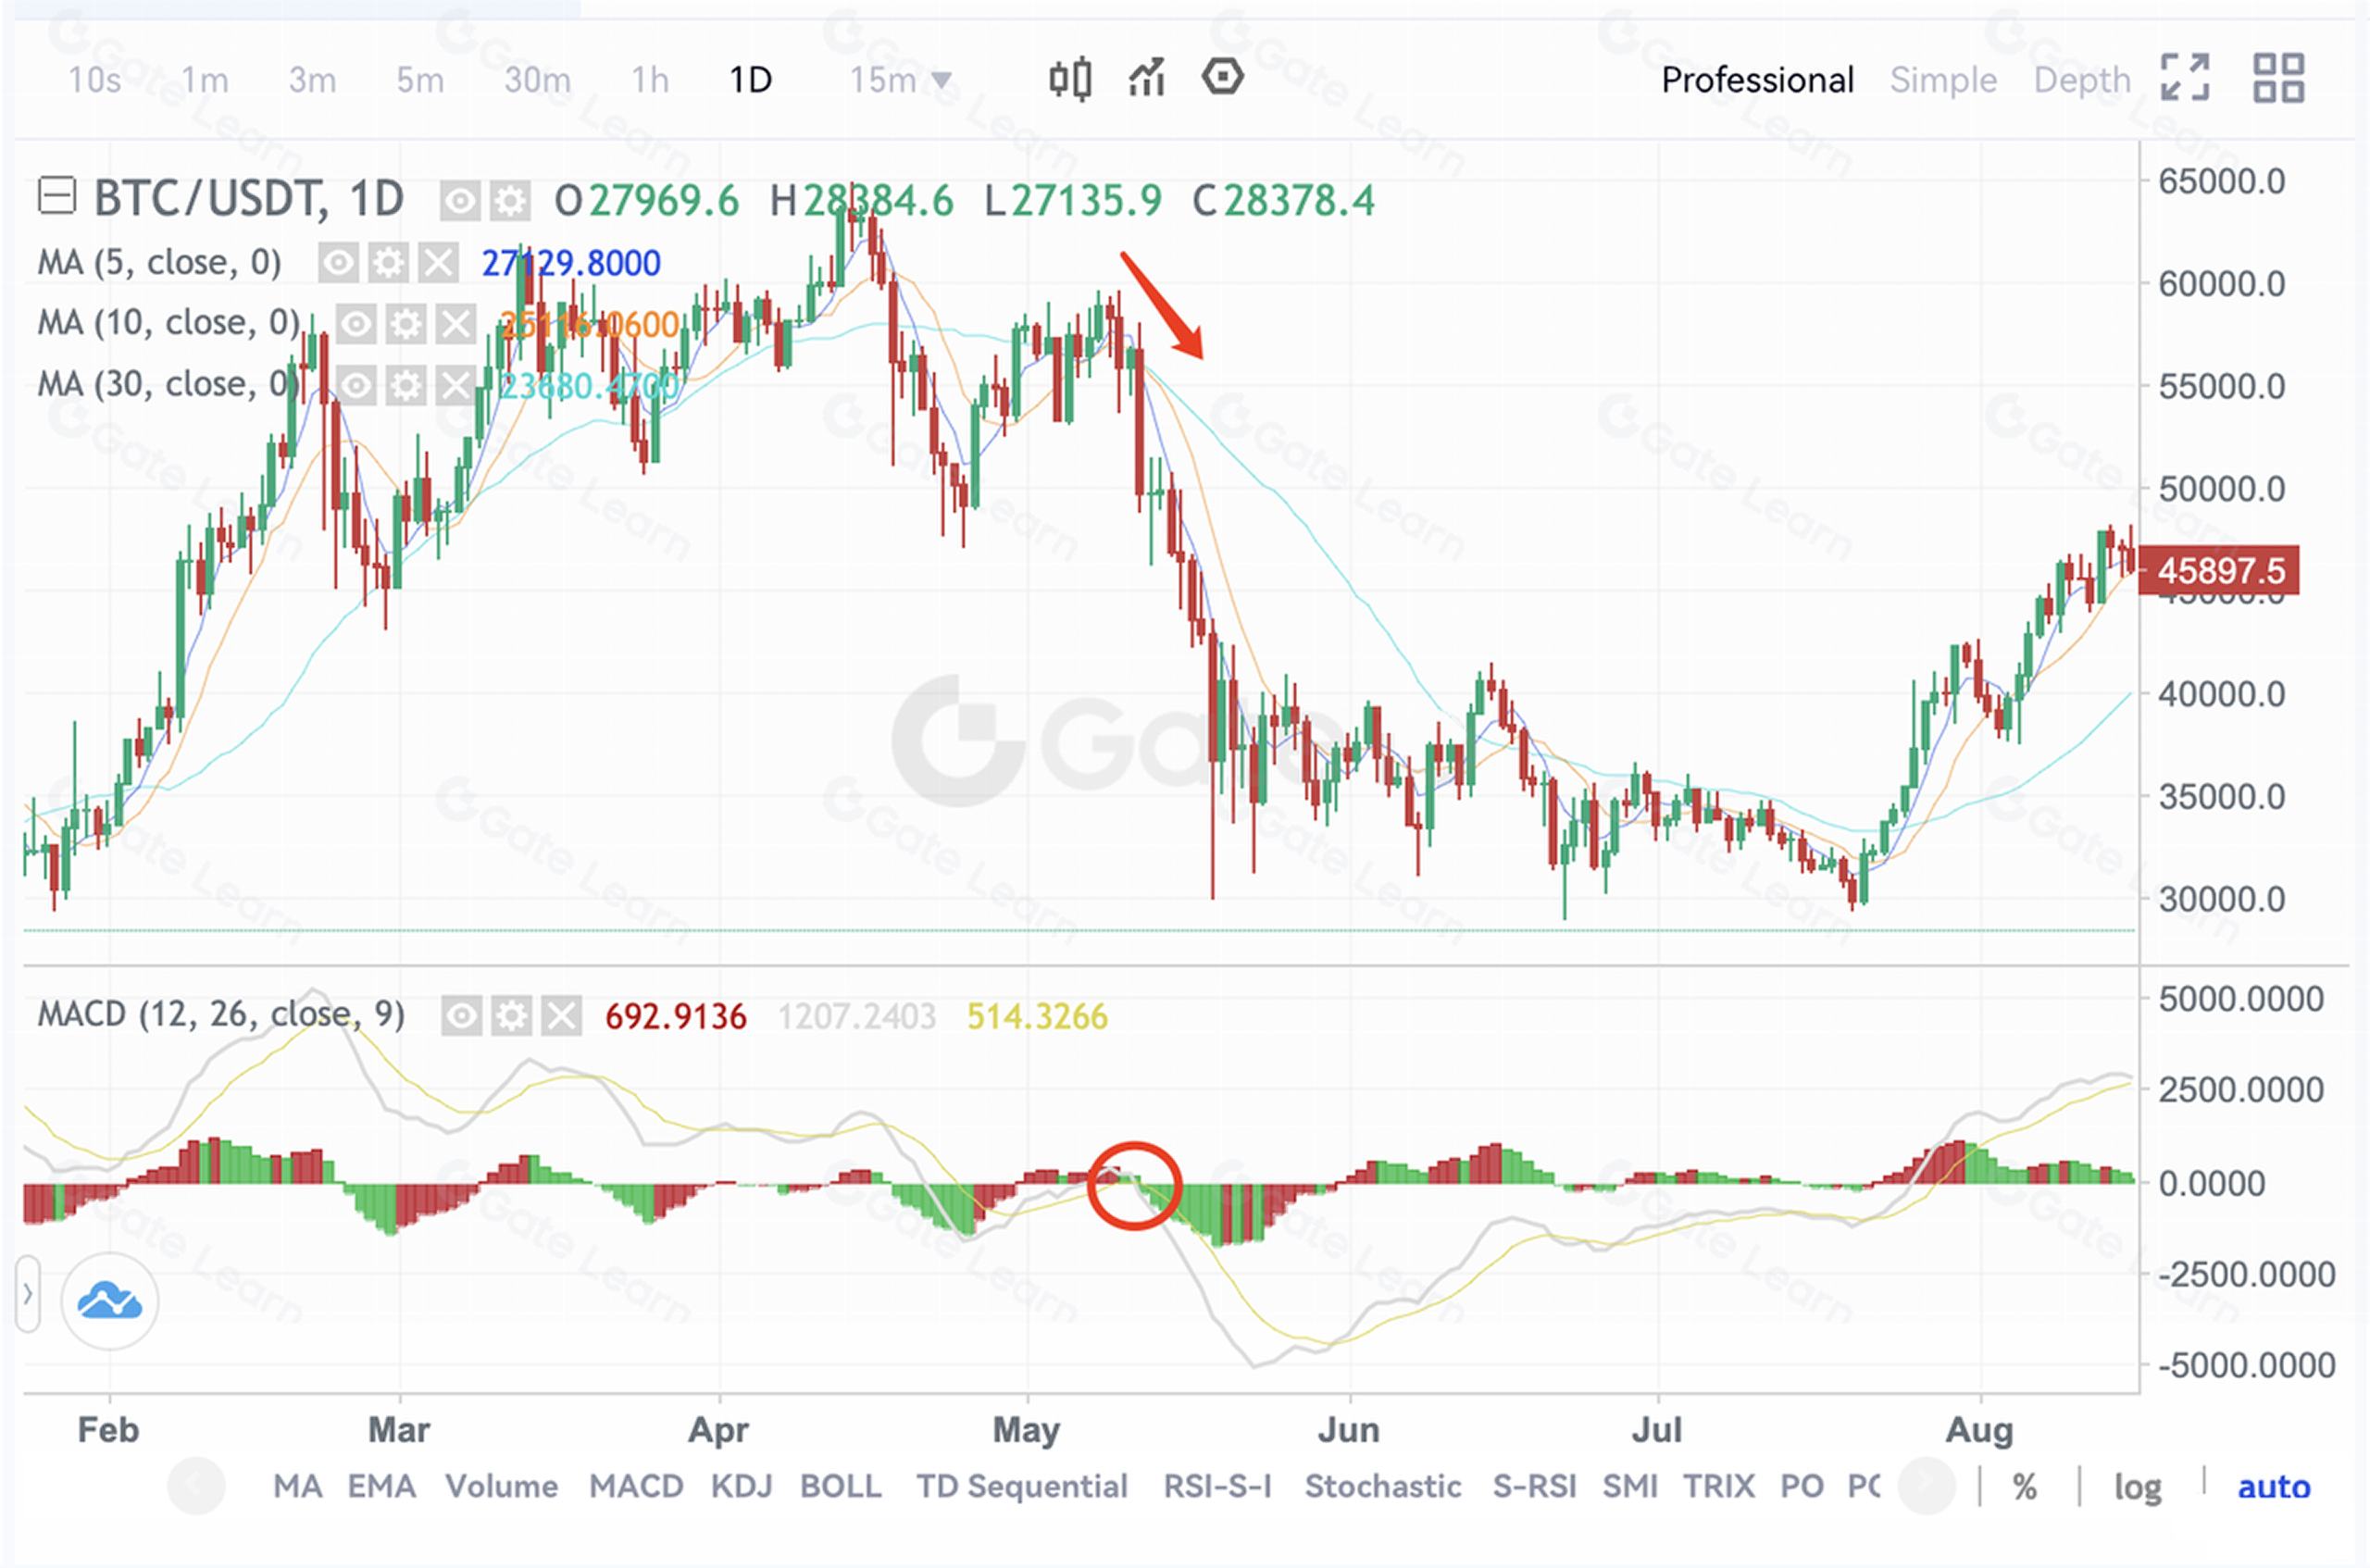
3.When both DIF and DEA are above the 0 axis, but DIF goes down to break through DEA - the bullish trend is about to end, a bear market is imminent, and the currency price will fall, so it is the right time to exit your positions. The cross formed by the two lines is a form of MACD death cross.
4.When DIF and DEA are both below the 0 axis, and DIF falls to break through DEA downward - a new round of strong decline is about to come, and currency prices will continue to fall, so it is time to get rid of the assets or just wait and see. The cross formed by the two lines is another form of MACD death cross.
(3) Divergence
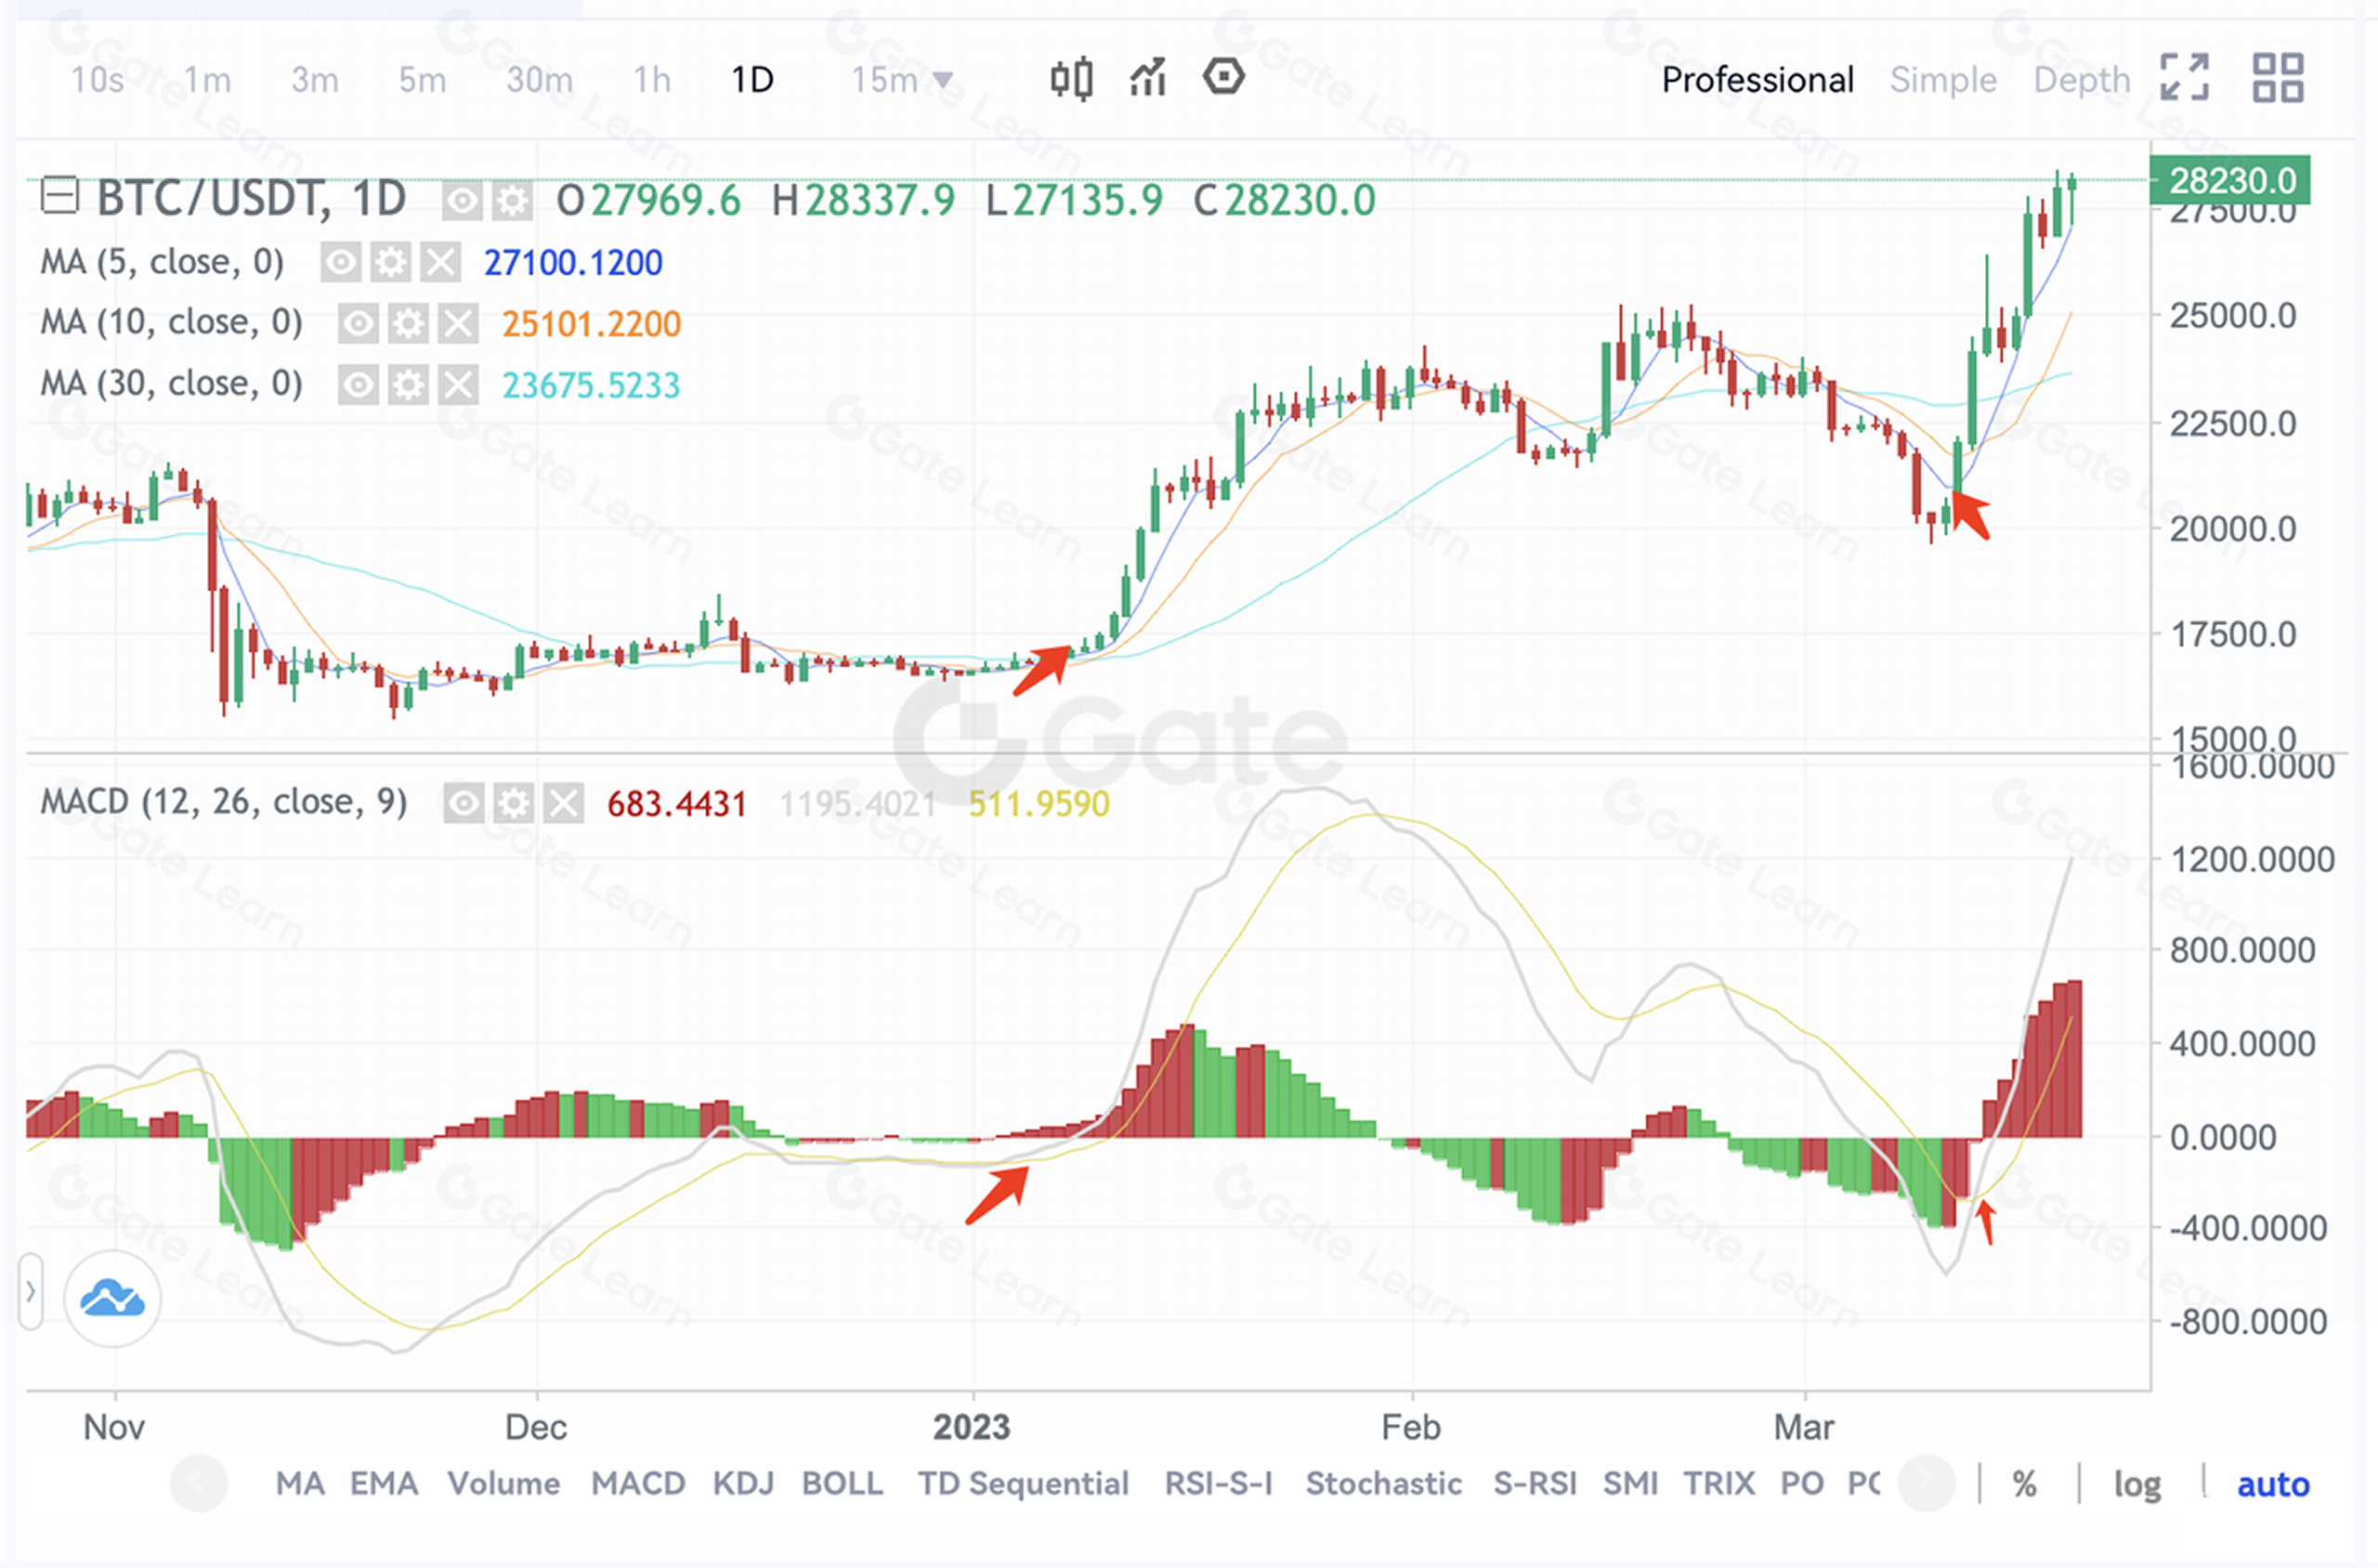
1.Bottom divergence Divergence refers to the phenomenon in which the price reaches a new high (low), while the indicator does not follow suit. Specifically, in the case of bottom divergence, the price hits a new low, but the DIF indicator does not. Bottom divergence, also known as bullish divergence, indicates that buying pressure is increasing and may be strong enough to initiate a new round of bullish growth at any time. This bottom divergence serves as a reversal-at-bottom signal. However, in trading, it is essential to examine other technical signals to confirm whether the reversal is part of a definite trend, such as a concurrent price breakthrough of the trend line or the 30-day moving average. As shown below:
2.Top divergence (Bearish divergence) Top divergence refers to the divergence between price and DIF, wherein the price reaches a new high, but the index does not. Top divergence, also known as bearish divergence, signifies a market shift from a bullish to a bearish trend, indicating that the price may have peaked and short positions can be initiated at any time to drive the price down. While top divergence suggests that the price is likely to experience a downturn at its peak, it is crucial to consider other indicators in actual trading to confirm the trend, such as the price falling below the trend line or the 30-day moving average.
Possible issues
1.Divergences after divergences Novice investors favor the divergence indicator because it is a valuable tool for determining when a market trend will reverse, enabling them to profit from “buying at the bottom and selling at the top.”
Veteran investors also regard divergence analysis as a useful tool, but they understand that the analysis can be quite complex, as situations might arise where “tops cover tops, bottoms cover bottoms, and divergence follows divergence.” As we all know, a strong trend does not end easily. Even though the divergence theory may help traders accurately predict when a price will reach its peak or bottom, it is essential to remember that divergences can appear in a continuous sequence, with the price resuming its original direction after two consecutive divergences.
2.Mechanical use of indicator One common mistake for novice traders when making successful transactions with an indicator tool, is that they tend to become overly dependent on the indicator, and will regard the method as an “omnipotent weapon” for all trade scenarios. Without exception, those who hold such a view, end with a loss, which may sometimes be greater than 100%. Mechanical use of any indicator without differentiating and understanding the trading scenarios leads nowhere. The wiser approach is to combine fundamental analysis with technical analysis to establish a systematic analytic framework and conduct market analysis from multiple perspectives. Only in this way can one increase the success rate in a volatile market.
Summary
MACD is known as the [King of Indicators] and always comes as the first on the list of must-learn indicators. All traders should master it to better understand the market, but should also keep in mind the indicator is flawed in certain aspects when reflecting the market sentiment. So in trading, MACD analysis is suggested to be used in combination with other technical analysis methods to get an accurate reading of the trend.
Register on the Gate Futures platform to start trading!
Disclaimer
Please note that this article is for informational purposes only and does not offer investment advice. Gate cannot be held responsible for any investment decisions made. The information related to technical analysis, market judgment, trading skills, and traders’ sharing should not be relied upon for investment purposes. Investing carries potential risks and uncertainties, and this article does not guarantee returns on any investment.
Lesson 1:Understanding The Moving Average
Lesson 2:Detailed Explanation of Granville 8 Rules
Lesson 3:Application of single moving average
Lesson 4:Application of Double Moving Average
Lesson 5:Application of Moving Average Array - Long Pattern
Lesson 6:Application of Moving Average Array - Short Pattern
Lesson 7:How to use Moving Average Patterns - Moving Average Cross
Lesson 8:How to Use Moving Average Patterns - Moving Average Bonding, Convergence and Divergence
Lesson 9:What is trend trading?
Lesson 10:What is the left-side and right-side trading
Lesson 11:What is the trend line
Lesson 12:How to Use Trend Line
Lesson 13:Support line and resistance line
Lesson 14:Application of MACD - the King of Indicators
Lesson 15:Application of Oscillating Indicator-KDJ
Lesson 16:Application of Relative Strength Indicator - RSI
Related Courses

Technical analysis: A useful tool to understand trends in Futures trading

Gate.io Simple Earn Investment Guide

Crypto Infolw : Coin , Data and News

Gate Futures Trading Guide - A must-read for newbies

Investing in Crypto
